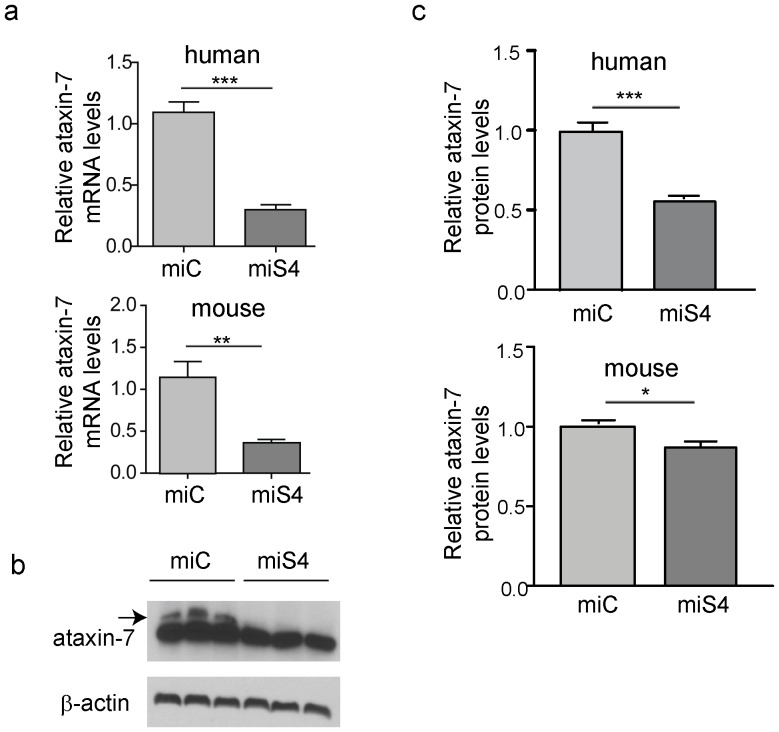
Figure 1. Reduction of ataxin-7 mRNA in the SCA7 mouse retina.
(a) Relative levels of human (top panel) or mouse (bottom panel) ataxin-7 mRNA levels one month post-injection with AAV2/1 miC or miS4. (b) Representative western blot demonstrating mutant human (upper band, denoted by arrow) and mouse ataxin-7 (lower band) protein levels one month post injection of AAV2/1 miC or miS4. For quantification (c), ataxin-7 protein levels were normalized to β-actin (upper panel, human protein; lower panel, mouse protein). For all panels, results are represented as mean ±SEM (n = 3), ***p<0.001, **P<0.01,*p<0.05.

