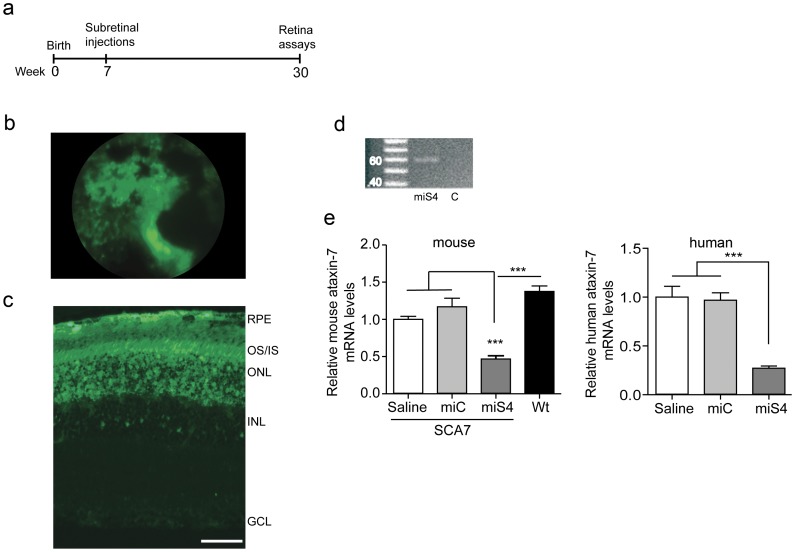
Figure 2. Sustained suppression of ataxin-7 expression.
(a) Experimental scheme. (b) eGFP fluorescence as observed by funduscopy. (c) eGFP fluorescence indicating transduction of the RPE, photoreceptors, outer nuclear layer and few inner nuclear layer cells in the SCA7 retina at 30 weeks. (d) miS4 expression validated by stem-loop PCR in retinal extracts (n = 3). miC was used as the negative control. (e) Relative levels of mouse (left panel) or human (right panel) ataxin-7 mRNA levels. Results are represented as mean ±SEM (n = 3 per group), *** p<0.001.

