
Figure 2. Amygdala rsFC -HA correlation analysis.
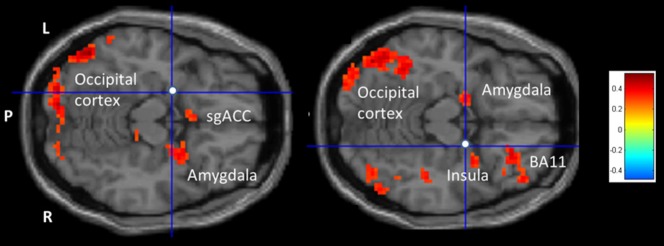
Transversal slide exhibiting positive (yellow to red) and negative (green to blue) correlation clusters for the correlation between the rsFC of the left amygdala seed (Left crosshair on white sphere; MNI coordinates: x = −20, y = −4, z = −15), the right amygdala seed (Right crosshair on white sphere; MNI coordinates: x = 22, y = −2, z = −15), and HA. For an overview of all significant clusters see Table 1 and Table 2. P = posterior, L = left, R = right, BA = Brodmann area.