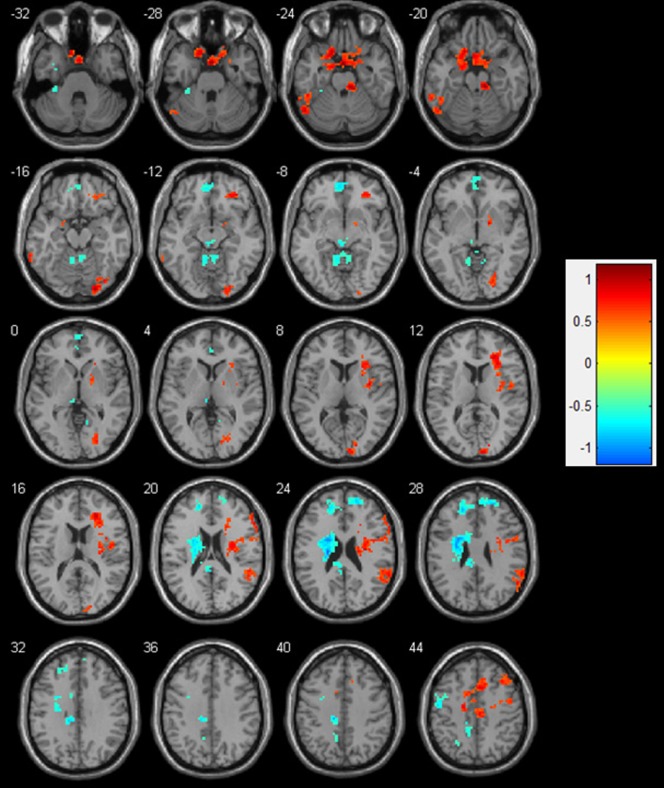
Figure 4. Left vs right amygdala rsFC -HA correlation analysis confined to high HA scoring females.
Transversal slides displaying the results of the rsFC-HA correlation analyses for the left vs. right amygdala rsFC seeds. Colors from yellow to red represent significantly stronger FC with the left compared to the right amygdala. Colors from green to blue represent the opposite: significantly stronger FC for the right compared to the left amygdala. For an overview of all significant clusters see Table 4.

