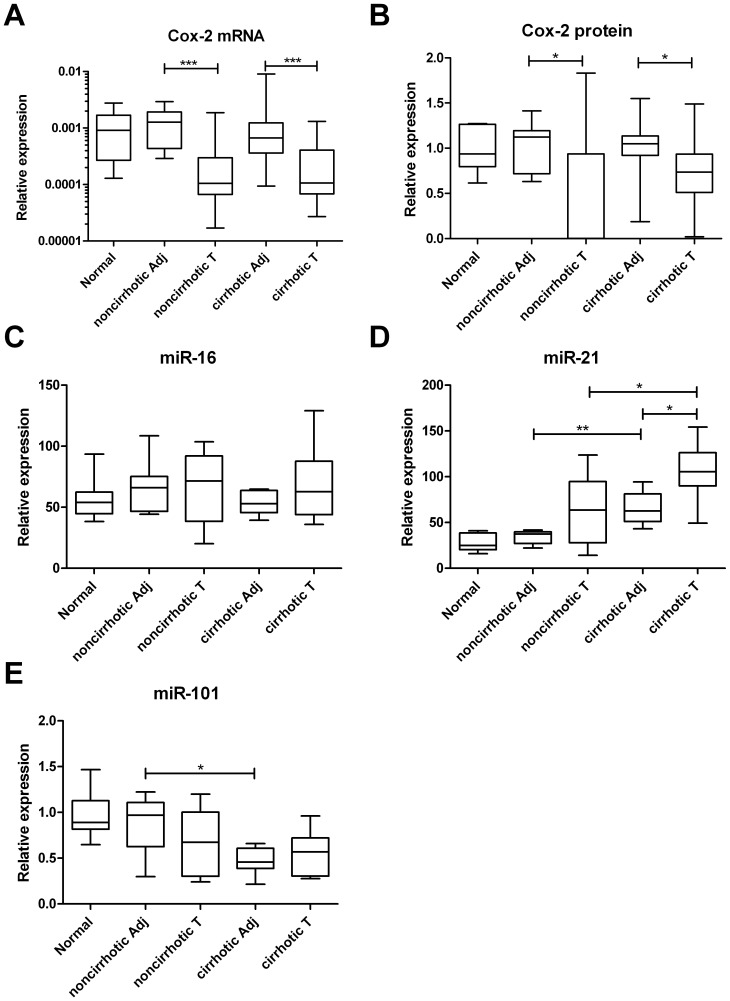
Figure 1. Plots representing relative expression of COX-2 mRNA (A), COX-2 protein (B), miR-16 (C), miR-21 (D) and miR-101 (E) in in normal liver, HCC tumor tissue (T) and tumor-adjacent parenchyma (Ad) in noncirrhotic and in cirrhotic liver.
Median values and 25th–75th percentiles are shown. P-values: *<0.05; **<0.01; ***<0.001.

