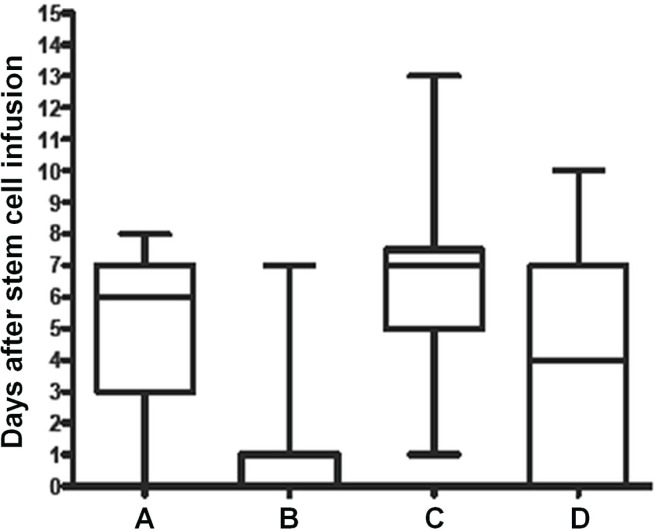
FIGURE 2.
Planned and actual median time to commencement of nutrition support. (A) Actual day nutrition support started (intervention arm). (B) Day nutrition support was planned to start per the protocol (intervention arm). (C) Actual day nutrition support started (control arm). (D) Day nutrition support was planned to start per the protocol (control arm). Each box marks the middle 50% of the data. The horizontal line within each box represents the median, and the whiskers extend to the 5th and 95th percentiles.

