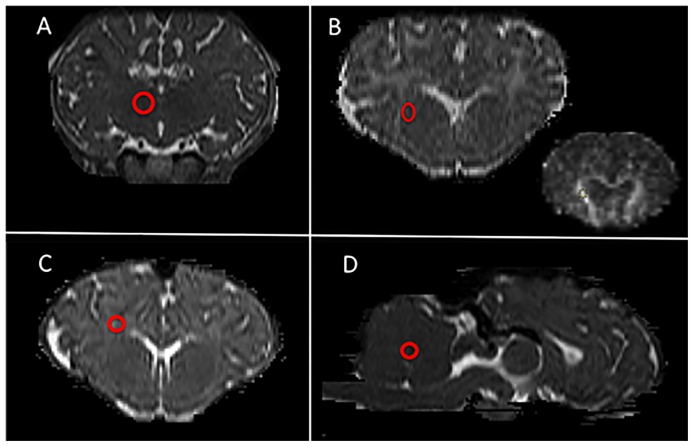
Figure 2. Regions of interest placement for DTI analyses.
Representative example of ROI placements (red circles) on high-resolution T2 images (A-C, coronal orientation; D, sagittal orientation). A: thalamus, B: internal capsule (inset: corresponding MD map), C: periventricular white matter, D: cerebellar vermis

