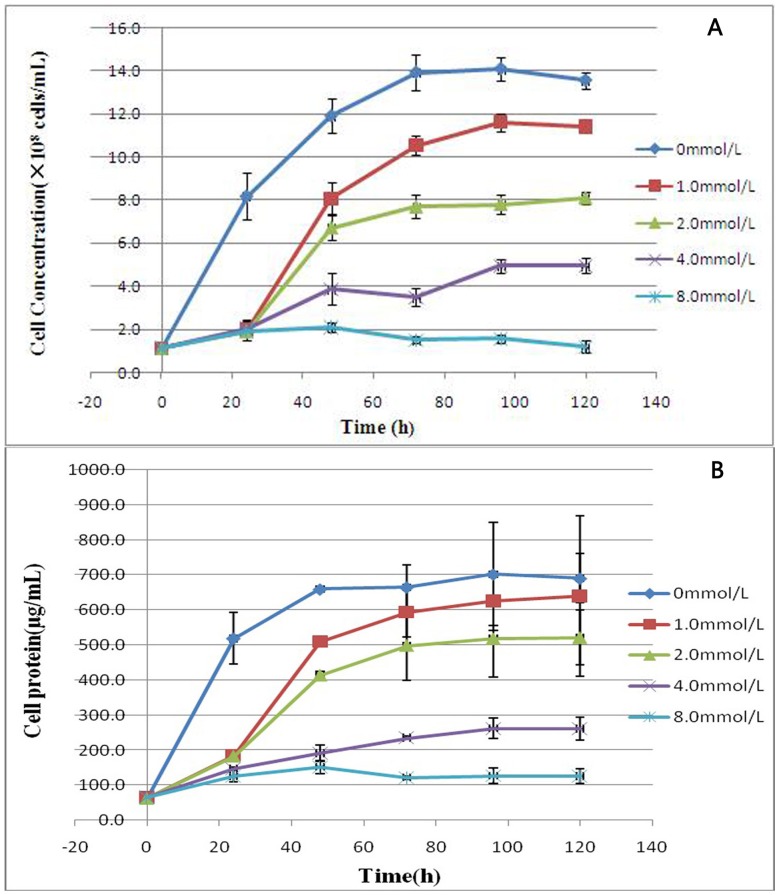
Figure 6. Time course of anaerobic phototrophic growth of Rhodopseudomonas palustris strain N in the presence of different selenite concentrations.
(A) Cell concentration of the strain. (B) Protein content of the strain. Symbols: ⧫, control cells (no selenite); ▪, 1.0 m mol/L; ▴, 2.0 m mol/L; ×, 4.0 m mol/L; *, 8.0 m mol/L. Selenite was added at time zero. Each curve shows means based on the results of three experiments.

