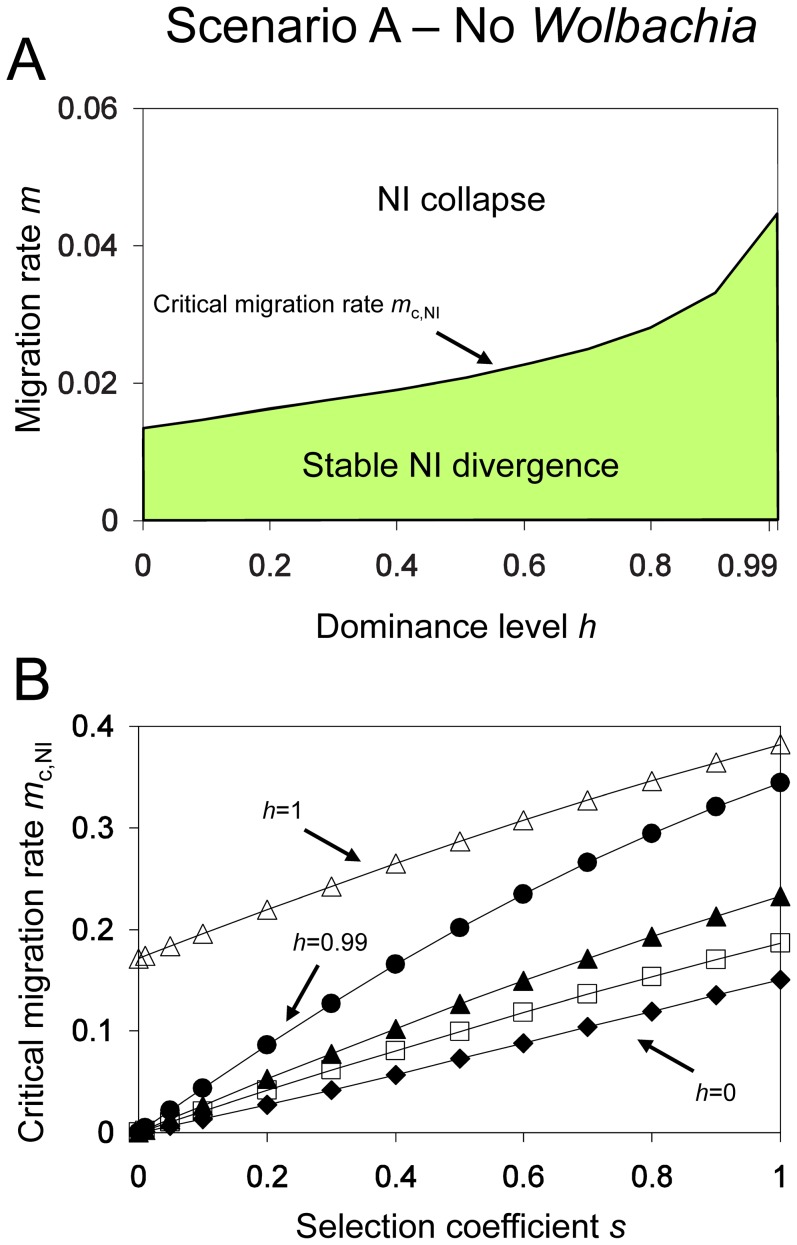
Figure 3. Stability of Dobzhansky-Muller incompatibilities (DMI) for Scenario A (No Wolbachia).
Graph A: The critical migration rate (m c,NI) divides the parameter plane spanned by dominance level (h) and migration rate (m) into two regions. If m<m c,NI then alleles Ai and Bi can persist on the island, and genetic divergence at both loci is stable (green region). For all other parameter constellations, polymorphism at either locus is lost and DMI disappear (white region). The graph further shows that stability of genetic divergence increases with degree of genetic incompatibility. Parameters: l NI = 1 and s = 0.1. Graph B: Critical migration rates as functions of the selection coefficient for different dominance levels h = 0 (diamonds), h = 0.5 (boxes), h = 0.75 (black triangles), h = 0.99 (circles) and h = 1 (white triangles). Local selection has increasing effects on stability with increasing selection coefficient, and the largest changes occur for nearly dominant hybrid lethality (h = 0.99). Other parameter: l NI = 1.

