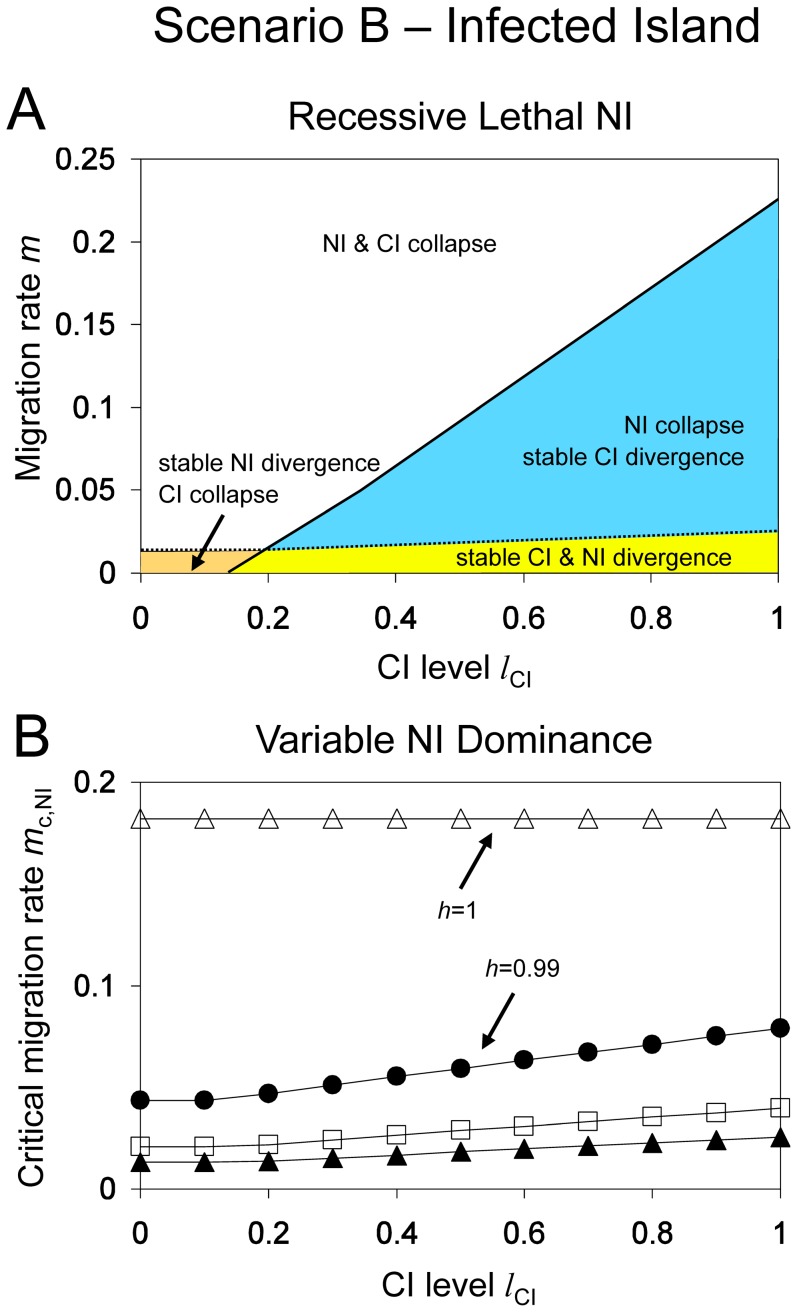
Figure 4. Stability of nuclear and cytoplasmic divergence for Scenario B (unidirectional CI with infected island population).
Graph A: Recessive Lethal NI. The parameter plane is divided into four zones: (1) stable NI and loss of Wolbachia (orange), (2) stable NI and Wolbachia persistence (yellow), (3) loss of NI and Wolbachia persistence (blue), (4) loss of both NI and Wolbachia (white). The dotted and solid lines indicate the critical migration rates of NI and CI, respectively. Note that Wolbachia causes a fecundity reduction of f = 0.1. Other parameters: l NI = 1, h = 0, s = 0.1. Graph B: Variable Dominance NI. Critical migration rates of nuclear divergence (m c,NI) as function of the CI level and for different dominance levels h = 0 (black triangles), h = 0.5 (boxes), h = 0.99 (circles) and h = 1 (empty triangles). Parameters: l NI = 1, s = 0.1, f = 0.1.

