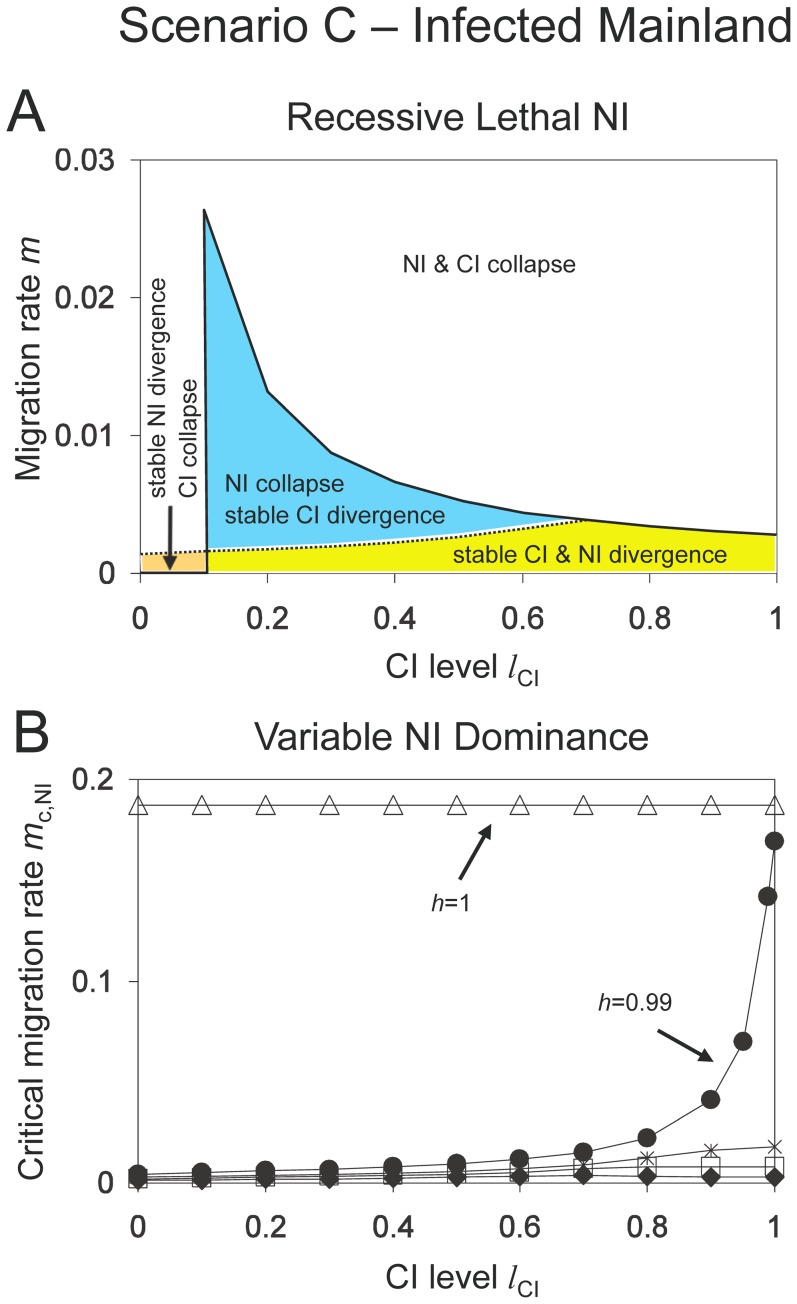
Figure 5. Stability of nuclear and cytoplasmic divergence for Scenario C (unidirectional CI with infected mainland population).
Graph A: Recessive Lethal NI. Critical migration rates of NI (dotted line) and CI (solid line) as functions of the CI level. As in figure 4, the parameter space is divided into four zones. CI collapse is either caused by the spread of Wolbachia on the island (lCI>0.1) or by Wolbachia loss in both populations (lCI<0.1). Other parameters: l NI = 1, h = 0, s = 0.01, f = 0.1. The graph shows that unidirectional CI has only weak effect on the stability of recessive NI. Graph B: Variable Dominance NI. Critical migration rates for nuclear divergence as functions of the CI level for different dominance levels h = 0 (diamonds), h = 0.5 (boxes), h = 0.75 (daggers), h = 0.99 (circles) and h = 1 (triangles). Parameters: l NI = 1, s = 0.01, f = 0.1. Unidirectional CI has the largest effects on stability of NI when the CI level is high and dominance is near perfect, but has some leakage (e.g. h = 0.99). In this case, CI and NI act synergistically in the sense that both CI and NI reach much higher critical migration rates than either alone in the corresponding mainland-island models.

