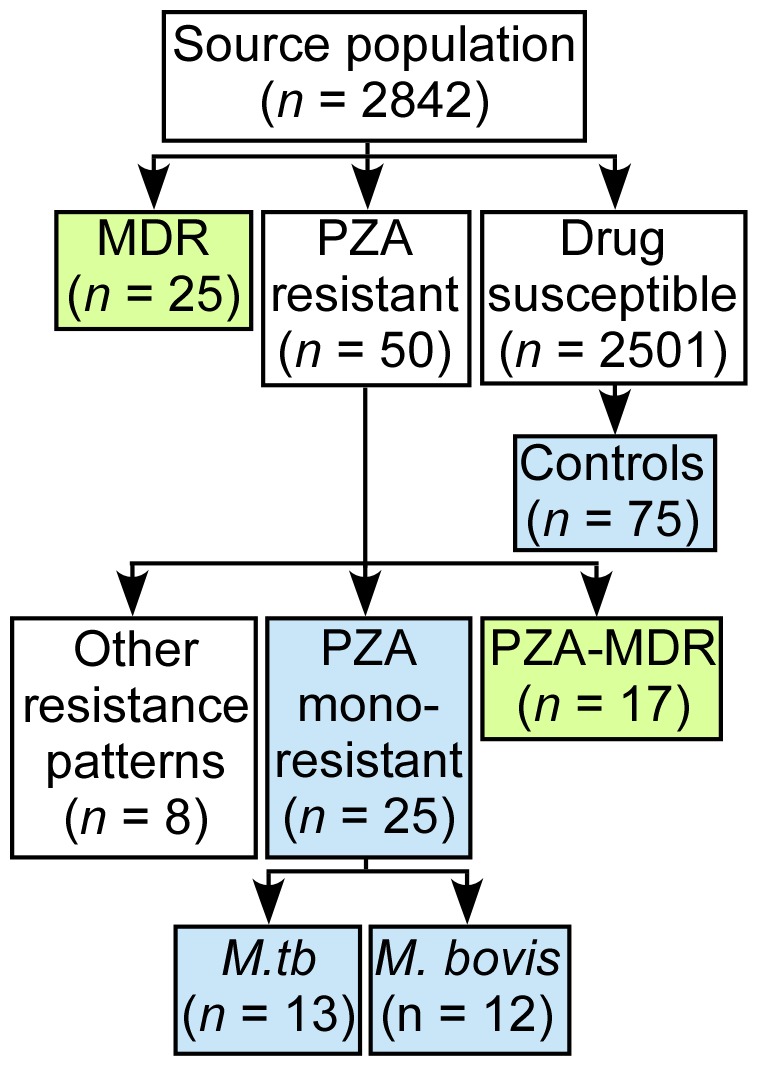
Figure 1. Flow diagram of cohort selection.

Between 1991–2011 in San Francisco county, there were 2842 cases of culture confirmed tuberculosis infection with complete antibiotic susceptibility data. Among these, 25 MDR cases and 50 PZA resistant cases were reported. Three time-matched drug susceptible controls (n = 75) with the same site of infection, pulmonary or extrapulmonary, were selected among the total number of susceptible controls (n = 2501) for each PZA monoresistant case. The blue boxes indicate the first case-control group, which compared patients infected with drug susceptible M.tb (n = 75) versus PZA monoresistant M.tb (n = 13) or M. bovis (n = 12). The green boxes indicate the second case-control group, which compared patients infected with MDR (n = 25) versus PZA-MDR (n = 17) M.tb. There were eight cases of infection with PZA resistance patterns that did not meet criteria for PZA monoresistance or PZA-MDR.
