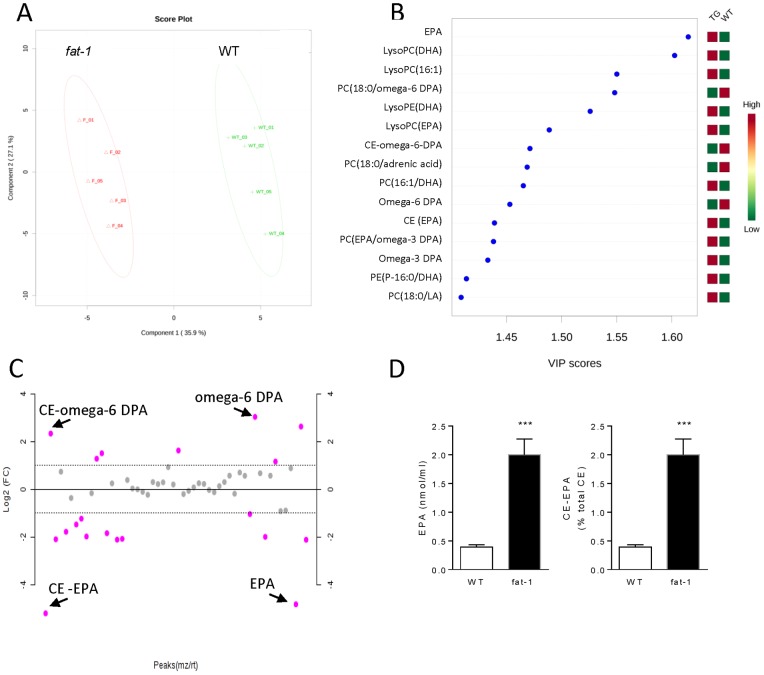
Figure 3. Untargeted lipidomic analysis.
A, PLS-DA analysis showed a marked separation of plasma samples belonging to WT and fat-1 mice, highlighting the features that contributed most to the variance between the two groups. B, Important features identified by PLS-DA. The colored boxes on the right indicate the relative concentrations of the corresponding metabolite in each group under study. Variable Importance in Projection (VIP) is a weighted sum of squares of the PLS loadings taking into account the amount of explained Y-variation in each dimension. C, Important features selected by fold-change analysis (relative to WT) with threshold 2. The red circles represent features above the threshold. Note the values are on log scale, so that both up-regulated and downregulated features can be plotted in a symmetrical way. D, Levels of EPA and percent composition of CE-EPA in WT and fat-1 mice (n = 5, Student's t test; ***, p<0.001). The data present the mean ± SEM.

