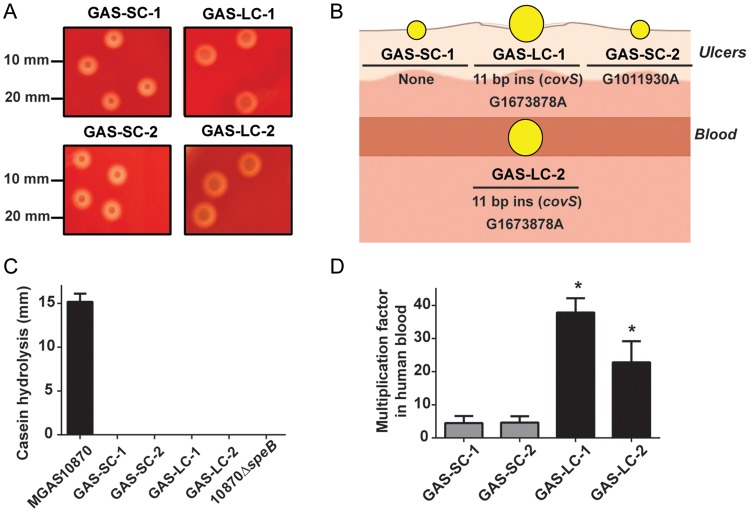
Figure 1.
Characterization of GAS isolates. A, Comparison of colony phenotypes for SC and LC isolates. B, Schematic of GAS isolates from this study. Location of isolation (either ulcers or blood) is shown as are genetic polymorphisms relative to the other 3 isolates identified by whole genome analyses and confirmed by Sanger sequencing. C, SpeB activity measured by casein hydrolysis assay. Strains MGAS10870 (SpeB producing isolate) and its isogenic SpeB-inactivated derivative are included as positive and negative controls, respectively. Strains were grown in triplicate on 3 separate occasions, and data graphed are mean ± SD. D, Comparison of SC and LC isolates during growth in human blood. Data graphed are mean ± SD of isolates grown in triplicate in blood from 3 separate donors (ie, 9 data points per strain). *Indicates that the multiplication factors for each LC isolate was significantly higher (P < .05) compared to the SC isolates as determined by ANOVA using Tukey post hoc test to account for multiple comparisons (calculations performed in Prism GraphPad version 6). Abbreviations: ANOVA, analysis of variance; GAS, group A Streptococcus; LC, large colony; SC, small colony; SD, standard deviation.

