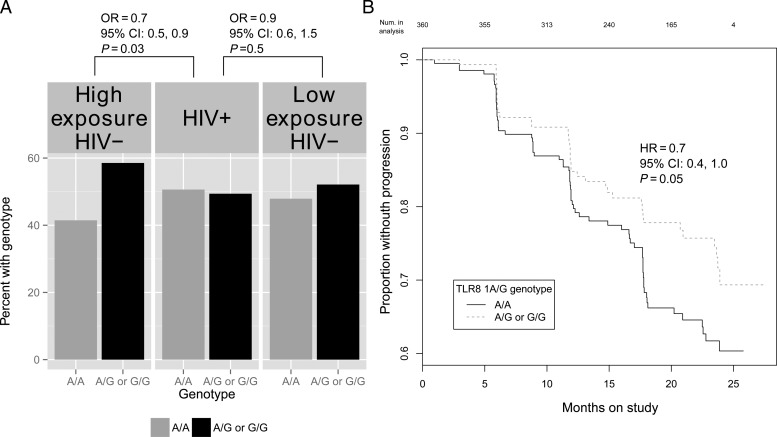
Figure 1.
A, Frequency of the TLR9 1635A/G (rs352140) single nucleotide polymorphism by HIV-1 infection status and level of HIV-1 exposure. HIV-1 exposure scores were used to represent an individual's risk of infection at enrollment and were based on a Cox proportional hazards regression model that included HIV-1 plasma RNA levels of the infected partner, unprotected sex, age, sex, and male circumcision. B, Kaplan-Meier plot of HIV-1 progression by TLR8 1A/G (rs3764880) genotype. HIV-1 progression is defined as CD4 < 200 cells/mL3, ART initiation, or death among HIV-1 seroprevalent cases with enrollment CD4+ T cell counts greater than 200.

