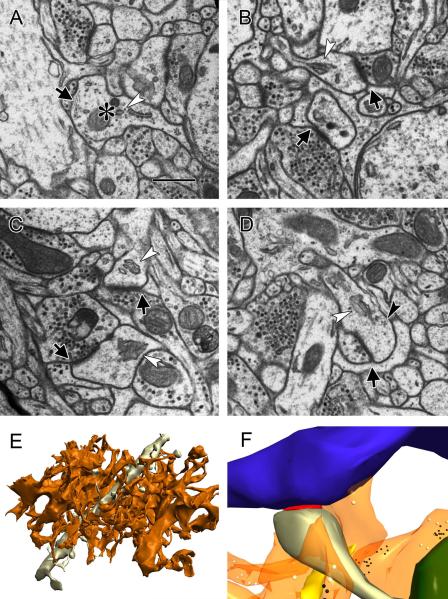
Figure 1.
Astrocytes in the rat lateral amygdala. A) Electron micrograph of an astrocytic process (asterisk) containing distinctive filamentous structures (arrow) and glycogen granules (i.e. arrowhead). scale=500nm B-D) Contact between astrocytic processes and the synaptic cleft (arrows) at spines with a spine apparatus (white arrowheads) and polyribosomes (black arrowhead in D). E) Three dimensional reconstruction of the processes of a single astrocyte contained in one 930μm3 tissue volume (orange), with a 10.25μm dendritic segment (gray). F) Reconstruction of a tripartite synapse. Blue: axon; gray: dendrite; orange: astrocyte; red: synaptic cleft; green: mitochondria; yellow: smooth endoplasmic reticulum; black: ribosomes; white: glycogen granules.

