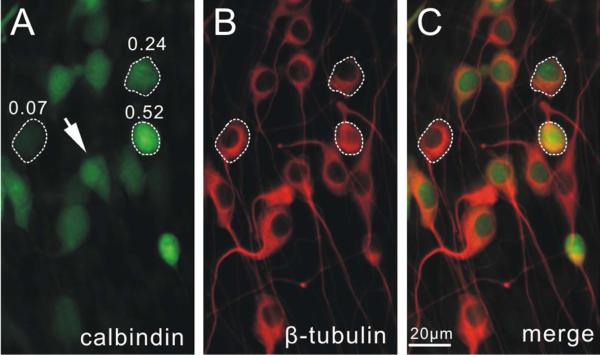
Figure 1. Subcellular distribution and characterization of immunostaining levels.
Representative double immune-stained images of neuronal cultures using anti-calbindin (A) and anti-β-tubulin (B) antibodies. C, merged image. Note that calbindin staining was heterogeneous while β-tubulin staining level was relatively uniform in all cells. Arrow, a neuron stained with anti-calbindin antibody showed brighter spots in the nuclei, suggesting differential staining levels within different sub-cellular compartments. Three cells with high, intermediate and low levels were circled with dashed line, and the normalized calbindin staining irradiance values was indicated on top of each cell in A. A magenta-green version of this figure is available as supplementary materials.

