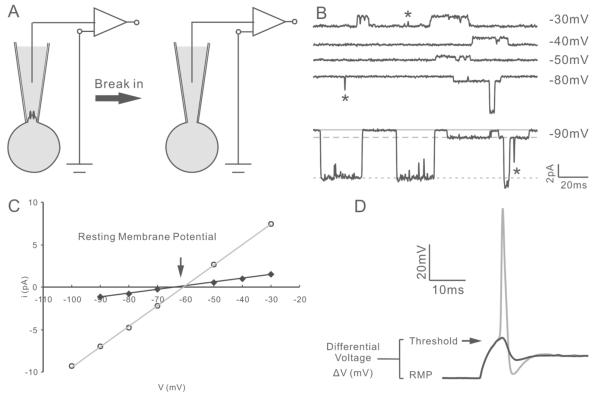
Figure 2. Non-invasive measurement of resting membrane potential.
A, diagram of the recording procedure. Cell-attached single channel recording was used to non-invasively assess the resting membrane potential (left). Additional suction was applied to break-in for subsequent whole-cell current clamp recording (right). B, single channel traces at the indicated test potentials from −60mV holding potential. Based on relative amplitude, two types of channel openings with small and large amplitudes could be observed. Solid line, closed state; dashed line, opening of the small-conductance channel; dotted line, opening of the large-conductance channel. Transient currents (asterisk) were due to incomplete channel opening events and were not used for the analysis of conductance. C, I-V relation of two channels plotted from the recordings in B. The two channels exhibited distinctive conductances (43.7pS and 240.6pS) but comparable reversal potentials (−63.5mV and −60.3mV, respectively). D, superimposed exemplary traces showing sub-threshold (black) and threshold (gray) measurements of voltage threshold and differential voltage. The cell was held at the endogenous resting membrane potential calculated on-line from cell-attached recording.

