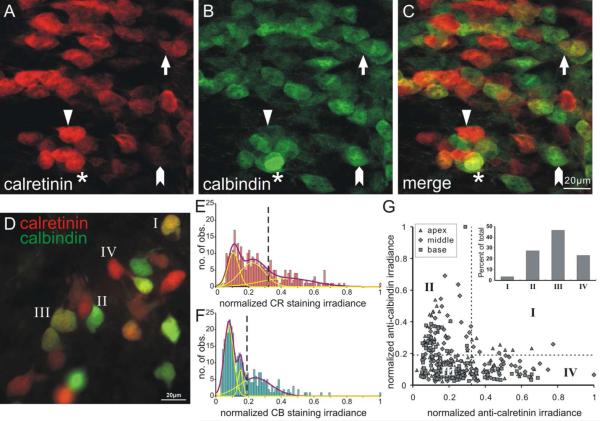
Figure 4. Calretinin and calbindin exhibited differential distribution patterns in murine spiral ganglion.
A-C, The mid-cochlear region of a whole-mount preparation of P7 mouse spiral ganglion labeled with mouse anti-calretinin (A) and rabbit anti-calbindin (B) antibodies. C, The merged image of A and B. Most cells were labeled by mainly calretinin (triangle), mainly calbindin (arrowhead), or a low level of both (arrow). Only a few neurons possessed a high level of both staining (asterisk). Scale bar in C (20μm) applies to A-C. D, Superimposed image of in vitro culture shows heterogeneous distribution pattern of calretinin and calbindin that range from mainly calretinin-staining cells (red) to mainly calbindin staining cells (green) similar to A-C. Example cells were labeled according to the four categories in G. Frequency histograms of normalized calretinin staining irradiance (E) and normalized calbindin staining irradiance (F) were constructed from measurements of the same single experiment as shown in D (total number of measurements = 320). Both histograms were composed of multiple populations with distinct staining irradiance levels which could be fit by the sum of three Gaussians with discrete means. The vertical dashed lines (E and F, respectively) delineate the mid points between high and medium means of Gaussian fits of normalized calretinin (0.32) and normalized calbindin (0.19) staining irradiance used in G inset. G, scatter plot of normalized calretinin and calbindin staining measurements in each neuron. Inset, Cells were divided into four categories to highlight relative irradiance patterns based on both x and y cutoffs (dotted lines in E-F).

