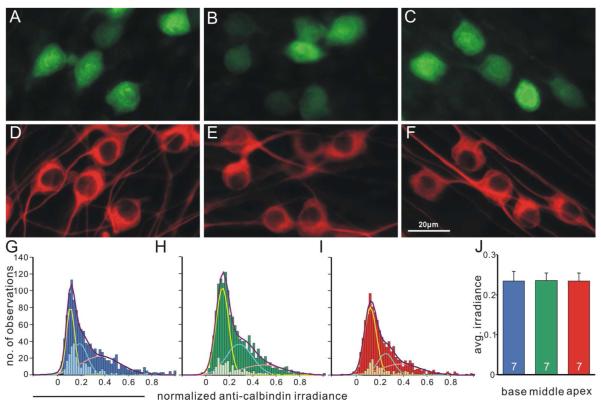
Figure 6. Calbindin staining pattern displays local heterogeneity but is generally even across different tonotopic regions.
A-C, Cultured neurons isolated from base, middle and apex respectively, labeled with polyclonal anti-calbindin antibody. D-F, Same neurons in A-C labeled with neuron-specific anti-β-tubulin antibody. Scale in F applies to A-F. G-I, Frequency histograms of normalized calbindin staining irradiance measurements from seven combined experiments were best fitted by the sum (purple curves) of three Gaussians (yellow, cyan and pink curves) with distinct means for base (G, dark blue bars, total No. of measurements, 1156), middle (H, dark green bars, total No. of measurements, 1463) and apex (I, dark red bars, total No. of measurements, 1018). Data points obtained from a single experiment exhibited as subsets of the full data set in each region and displayed heterogeneity. J, average calbindin staining irradiance is comparable in each region (n=7).

