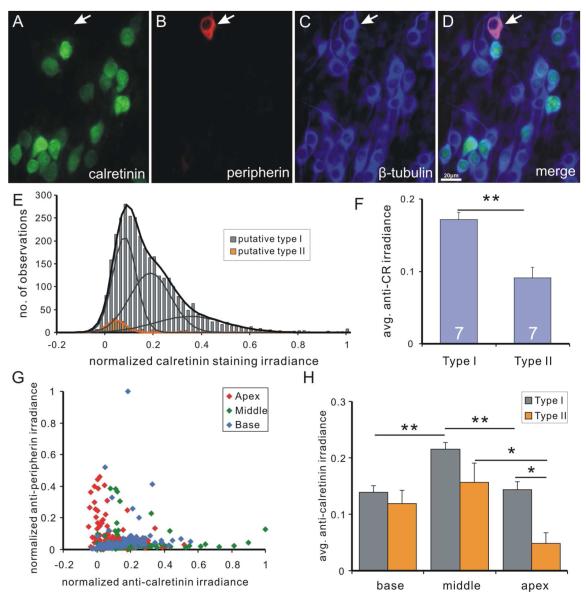
Figure 9. Calretinin staining irradiance is consistently low in putative type II spiral ganglion neurons.
A-D, spiral ganglion neurons in a neuronal culture triple-labeled with polyclonal anti-calretinin (A), anti-peripherin (B) and anti-β-tubulin (C) antibodies (D, merged image). Calretinin staining irradiance is undetectable in a putative type II neuron (arrow) with high peripherin staining irradiance. E, frequency histogram of calretinin staining irradiance measurements from seven pooled experiments. Cells with the highest 5% of peripherin staining irradiance (relative to the total number of neurons) were defined as putative type II neurons. Putative type I neurons (gray bars) are best fitted by the sum (black curve) of three Gaussians (gray curves) and histogram of putative type II neurons (orange bars) is best fitted by a single Gaussian (orange curve). F, average calretinin staining irradiance of type I neurons in an entire experiment is significantly higher than that of type II neurons (p<0.01, n=7). G, scatter plot of normalized calretinin staining irradiance and normalized peripherin staining irradiance from the same experiment as in E. H, Average calretinin staining irradiance level for type I (gray bars) and type II (orange bars) in different tonotopic regions. *, p<0.05, **, p<0.01.

