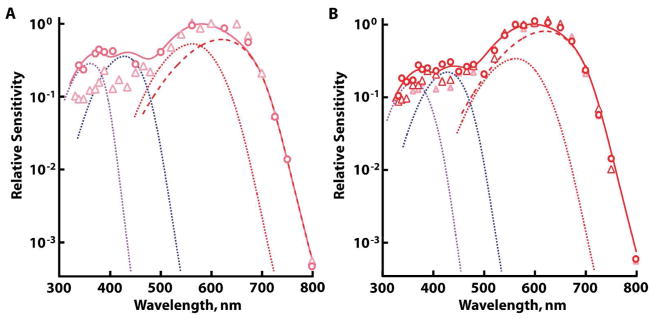
Figure 3.

Opsin mixtures indicated by spectral variation at short wavelengths in dark-adapted L cones. Cones with A1 L pigment content of 20–40% were selected for comparison. Component analysis (thick continuous line) of the cone with higher sensitivity to short wavelengths (circles) suggested the presence of UV A1 pigment (violet dotted line), S A1 pigment (blue dotted line), and L A1 (red dotted line) and A2 (red dashed line) pigments. A. Two double cones (circles and triangles). B. Two single cones (red symbols). The spectral sensitivity of the double cone with low sensitivity to short wavelengths is redrawn from A, for reference (pink triangles).
