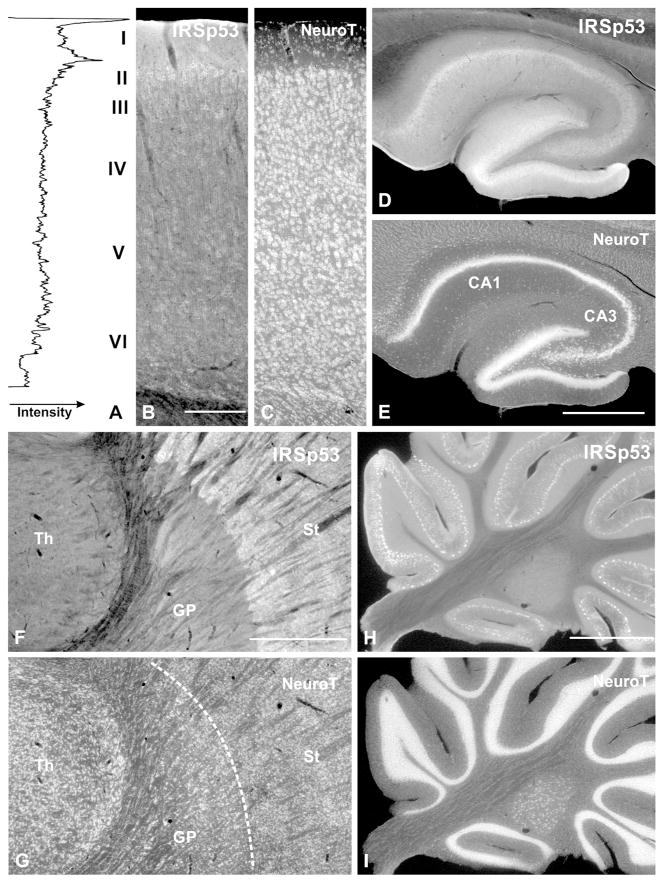
Figure 2.
Immunofluorescence labeling for IRSp53 in coronal sections. A–C, neocortex (S1); D–E, hippocampus; F–G, basal ganglia and thalamus; H–I, cerebellum. The sections illustrated were also stained with NeuroTrace to identify anatomical features (C, E, G, I). Fluorometric plot (left panel in A) provides a quantitative view of the dense immunostaining at the superficial border of cortical layer II. Neuropil of layer I is strongly immunopositive, but the “peak” at the top of the section is an edge artifact.
Abbreviations: Th: thalamus, GP: globus pallidus, St: striatum, NeuroT: NeuroTrace
Scale bar = 0.5 mm in A–C; 1 mm in D–I.

