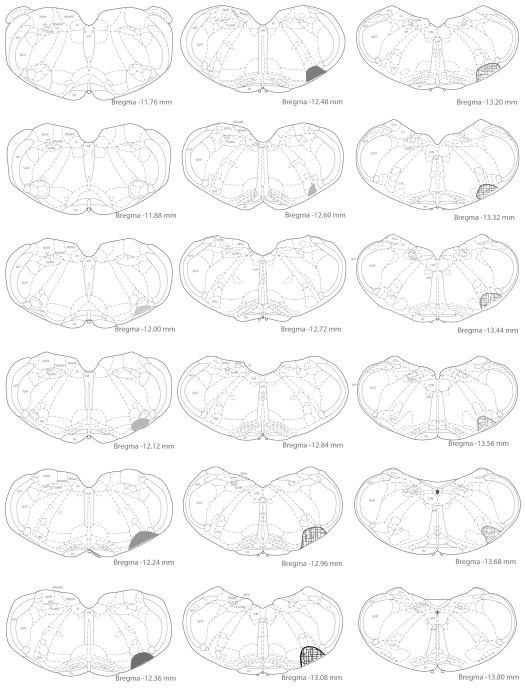
Figure 5.
Examples of injection site maps. The location of the injection site and extent of the local diffusion of tracer was identified in each animal using immunoperoxidase/diaminobenzidine-stained sections through the medulla. This site was then plotted on drawings of rat brain stereotaxic atlas sections (Paxinos and Watson, 2005) by matching the anatomical structures present on the ventral aspect of stained sections to the atlas images. In the two rats depicted in the figure, the injection site in the rostral ventrolateral medullary region (RVLM) extended from Bregma −12.00 to −12.66 and is illustrated by filled shapes; the injection site in the caudal ventrolateral medulla (CVLM) extended from Bregma −12.9 to −13.68 and is illustrated with hatchmark-filled shapes. For both injection sites, the shading opacity reflects the density of the labeling observed in the tissue sections.

