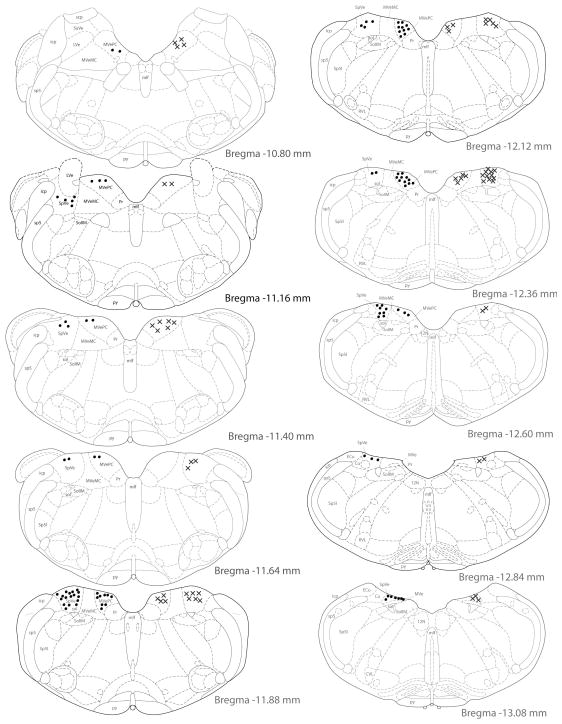
Figure 8.
Location of vestibular neurons that were activated by sGVS and had direct projections to the ipsilateral (filled circles on left side of each drawing) or contralateral (Xs on right side of each drawing) CVLM. The highest density of cells was observed at Bregma −11.88, with most of these activated projection neurons observed at or caudal to this level.

