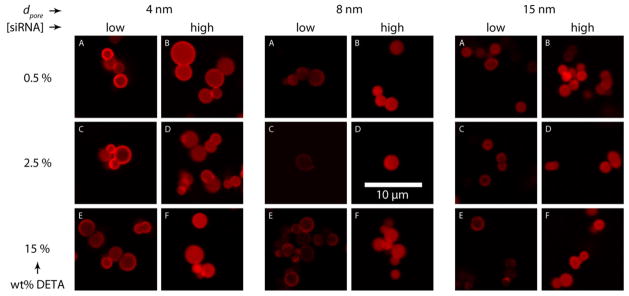
Figure 3.

Confocal microscopy of APMS particles loaded with fluorescently labeled siRNA. The figure compares the loading of siRNA at both low and high siRNA equilibrium concentrations for materials at several pore diameters, each with several levels of DETA surface modifications.
