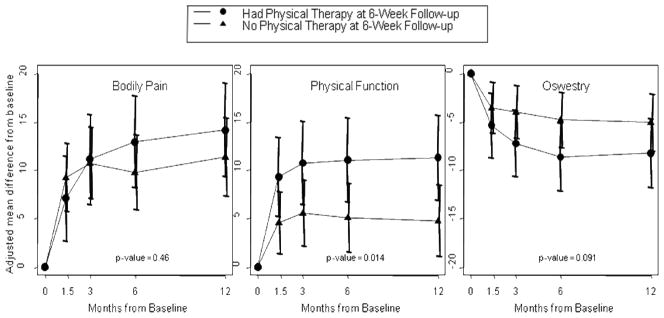
Figure 2.

Primary outcomes for patients who received or did not receive physical therapy during the first six weeks after enrollment during 1 year of follow-up. Graphs show adjusted mean change from baseline. Bodily pain and physical function scores from the SF-36 range from 0–100 with higher scores indicating less severe symptoms. The Oswestry index ranges from 0–100 with lower scores indicating less disability. Horizontal bars represent 95% confidence intervals. P-values are time-weighted average 1-year area under curve p-values.
