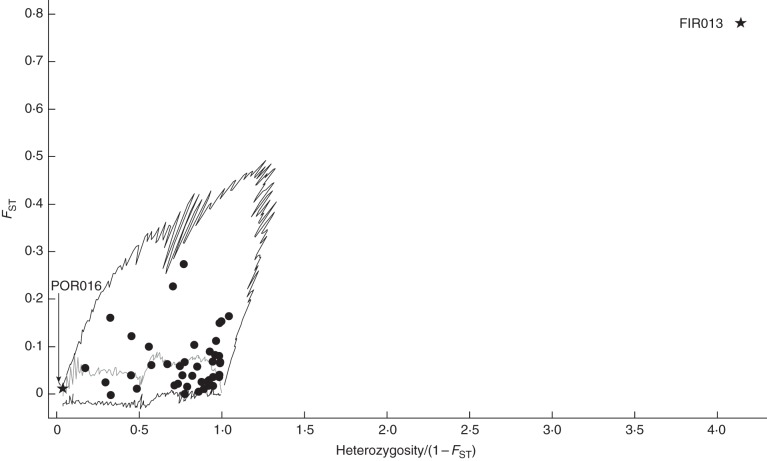
Fig. 3.
Outlier loci analysis of 44 markers between species among all four FC/Baraga Plains populations as calculated by LOSITAN (Antao et al., 2008). Outliers are indicated by a star while all others are circles, and black lines represent the 5 % quantiles, with markers outside the lower 5 % quantile under balancing selection and the markers outside the upper 5 % quantile under divergent selection, while the grey line represents the median (50 %).

