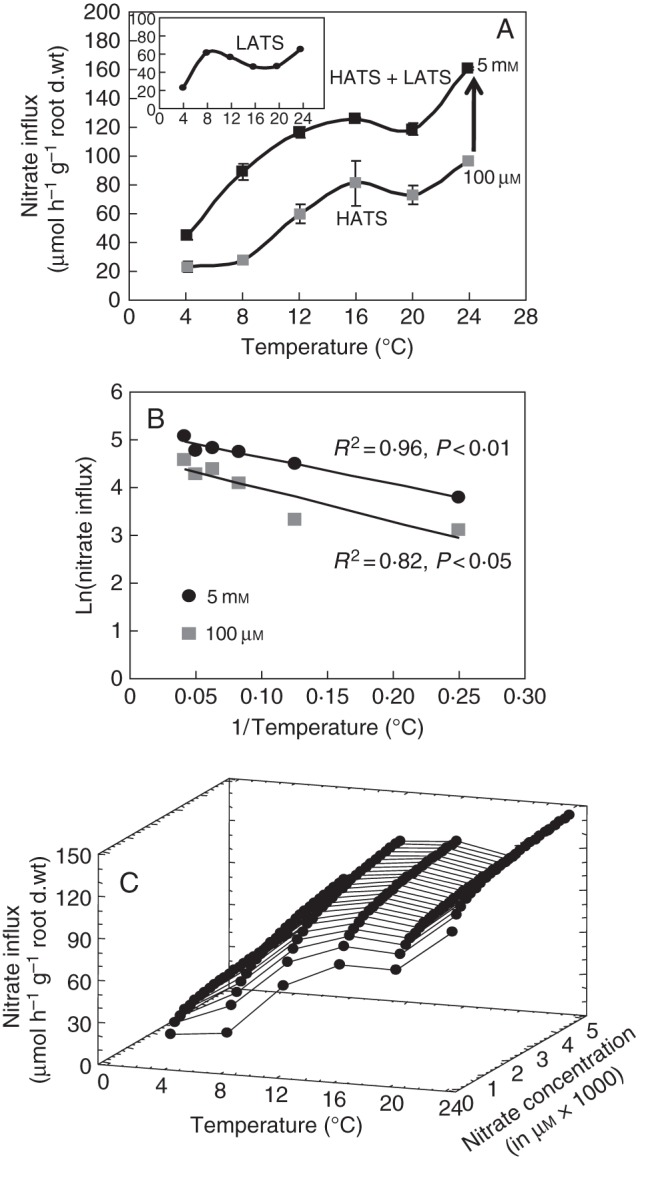
Fig. 3.

Reinterpretation of the temperature effect on nitrate influx rate. (A) Previous interpretation in the changes of nitrate influx rate as a function of root temperature (Malagoli et al., 2004). Inset: LATS activity obtained by subtracting HATS activity from HATS + LATS activity. (B) Arrhénius diagram deduced from nitrate influx variations. (C) Three-dimensional plot of the temperature effect on nitrate influx variations based on reinterpretation of nitrate uptake kinetics and deduced from the Arrhénius diagram, electrophysiological studies (Glass et al., 1992) and Thellier's transformation (see Fig. 1C, D). Vertical bars indicate SD for n = 3 when larger than the symbol.
