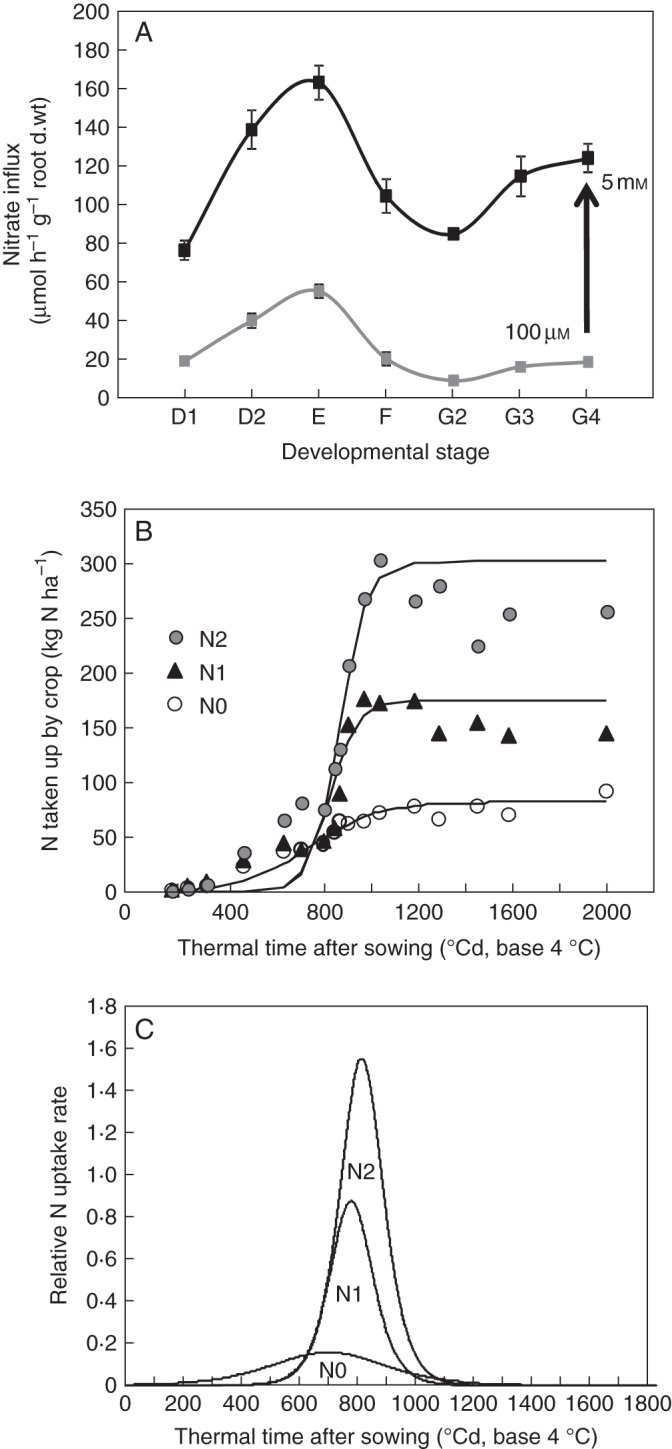
Fig. 4.

Determination on the duration and onset of developmental stages during the growth cycle. (A) New measurements in changes of nitrate influx rate as a function of developmental stages from Beuve et al. (2004). (B) Fitting of the quantity in total N exported plotted against thermal time with logistic curves for the three levels of fertilization. (C) Relative N accumulation derived from the logistic curves. Vertical bars indicate SD for n = 3 when larger than the symbol.
