
Fig. 2.
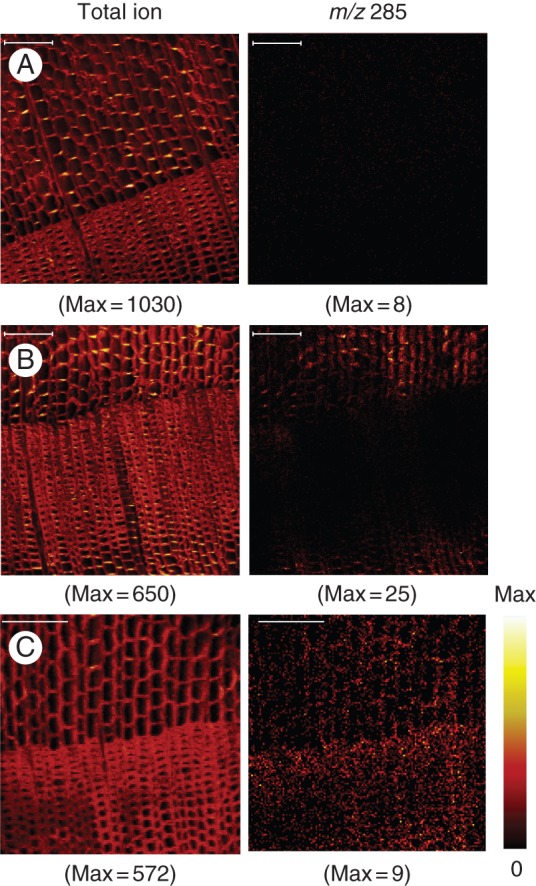
Typical positive TOF-SIMS images of total ion and m/z 285 in C. japonica xylem. Total ion (left) representing the xylem structure and m/z 285 (right) representing ferruginol localization were obtained from sapwood (A), intermediate wood (B) and heartwood (C). Maximum counts are shown in parentheses. Scale bars = 100 µm.