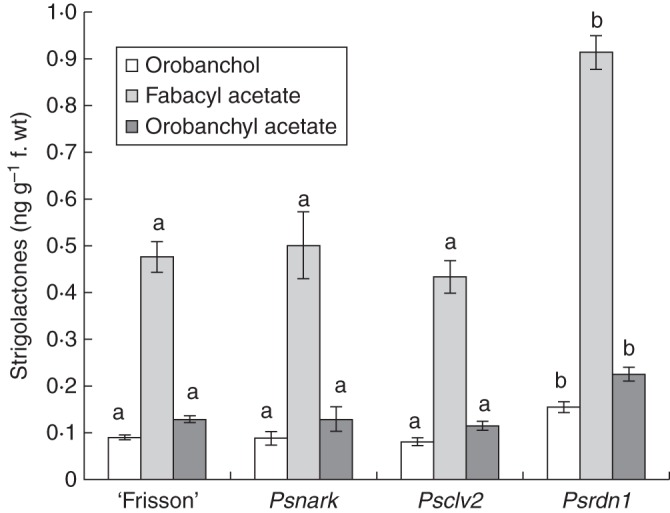
Fig. 5.

Strigolactone levels in the root tissue of 21-day-old wild type (‘Frisson’) and AON mutant lines, Psnark, Psclv2 and Psrdn1. Different letters above bars indicate significant differences between genotypes (separate ANOVAs were carried out on each strigolactone, P < 0·01). Values are the mean ± s.e. (n = 4).
