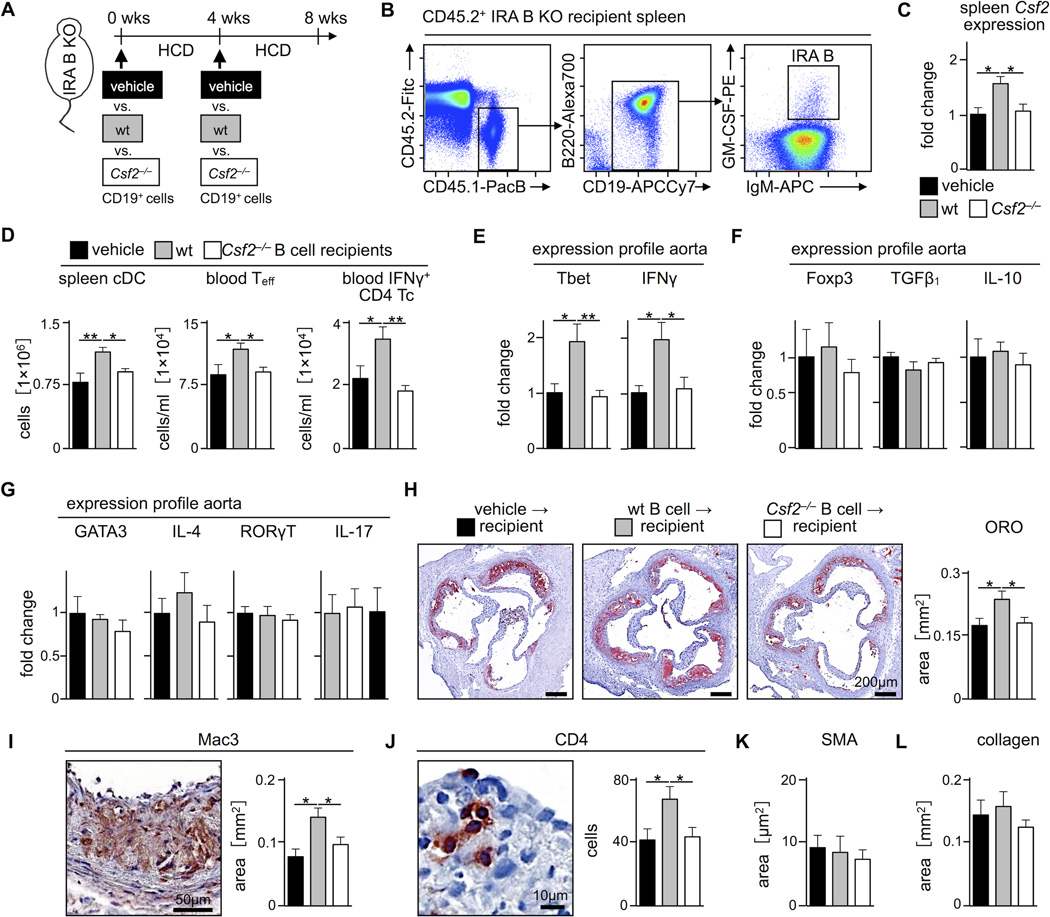
Figure 5.
Transfer of GM-CSF competent B cells aggravates atherosclerosis. (A) Experimental strategy for B cell adoptive transfer. Naive IRA B KO mice were divided into three groups receiving either 2.5 × 10⁷ CD19+ B cells from WT (gray) or Csf2−/− (white) mice (n = 7 per group) or vehicle (DPBS) alone (black) (n = 5) at week 0 and 4 of a 8 week period of HCD feeding. (B) Representative dot plots showing identification of IRA B cells in the spleen of a CD45.2+ IRA B KO recipient on HCD 8 weeks after transfer of 25 × 106 CD45.1+ WT B cells twice, 4 weeks apart. (C) Quantification of GM-CSF (Csf2) expression in whole spleen tissue of IRA B KO mice 8 weeks after transfer of WT (gray), Csf2−/− (white) (n = 7 per group) or no B cells (black; n = 5) by real-time PCR. Results are presented as mean ± SEM fold change of 2ΔCt, * p ≤ 0.05, comparing WT vs. the other groups by ANOVA. (D) Enumeration of spleen cDC, blood T effector cells, and blood IFNγ-producing T cells in recipients of WT (gray) cells compared to those receiving Csf2−/− (white) B cells (n = 7 per group) or vehicle (black; n = 5) after 8 weeks HCD feeding. Results are presented as mean ± SEM, * p ≤ 0.05, comparing WT vs. the other groups by ANOVA. (E–G) Quantification of TH1-associated Tbet and IFNγ, Treg-associated Foxp3, TGFβ1 and IL-10, and TH2- and TH17-associated GATA3, IL-4, RORγT and IL-17 expression in aortic tissue of WT (gray) versus Csf2−/− (white) B cell recipients (n = 7 per group) and vehicle group (black; n = 5) by real-time PCR. Results are presented as mean ± SEM fold change of 2ΔCt, * p ≤ 0.05, comparing WT vs. the other groups by ANOVA. (H) Quantification of ORO-rich areas in aortic root sections of recipients of WT (gray) versus Csf2−/− (white) B cells (n = 7 per group) and vehicle group (black; n = 5) on the right and representative images on the left. Results are presented as mean ± SEM, * p ≤ 0.05, comparing WT vs. the other groups by ANOVA. (I–L) Representative images and quantification of Mac3-, CD4-, SMA-positive and Masson’s trichrome staining in aortic root sections of the three groups. Results are presented as mean ± SEM, * p ≤ 0.05, comparing WT vs. the other groups by ANOVA.

