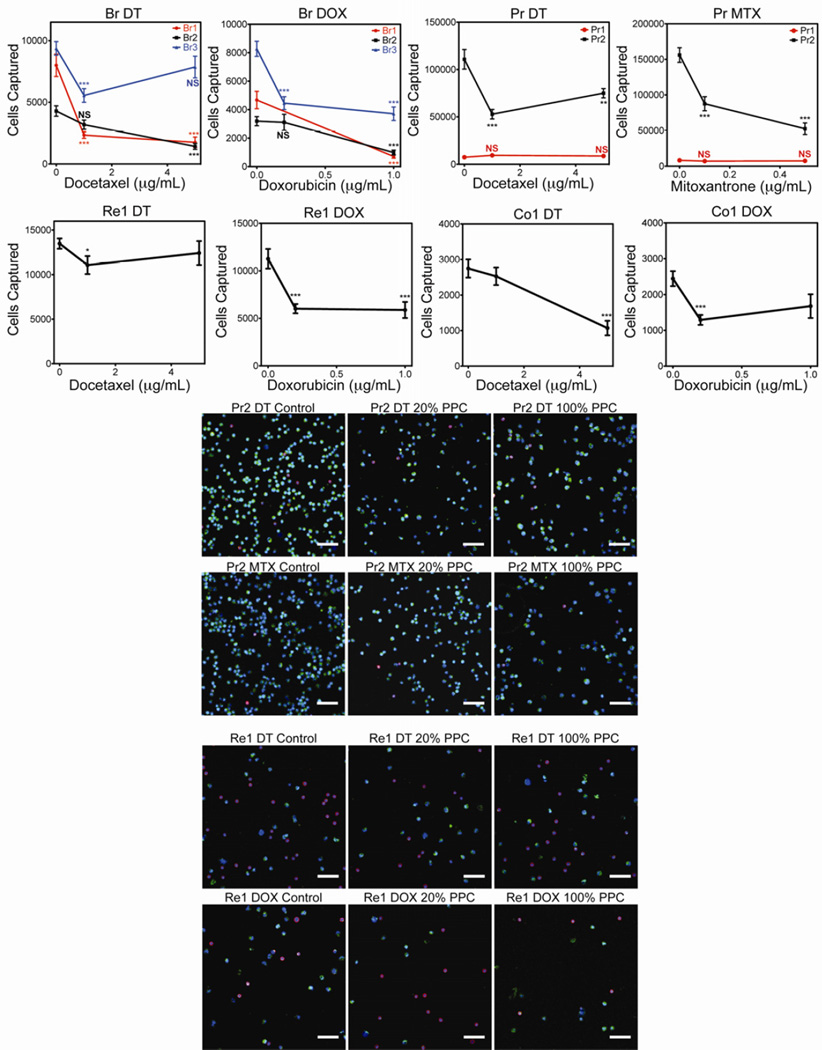
Figure 5.
Patient samples were collected from three breast cancer patients (Br1, Br2, and Br3), two prostate cancer patients (Pr1 and Pr2), one renal and one colon cancer patient (Re1 and Co1, respectively). Each tube of whole blood was split into three aliquots and treated with vehicle control, 20% PPC, or 100% PPC of the appropriate drug. DT = docetaxel, DOX = doxorubicin, MTX = mitoxantrone. Error bars represent standard error of the mean. * P < 0.05, ** P < 0.01, *** P < 0.001; scale bar=50 um. Representative micrographs of CTC capture from patient Pr2 and Re1 show the reduction in CTC count following drug treatment. Scale bars = 50 µm.

