
Figure 4.
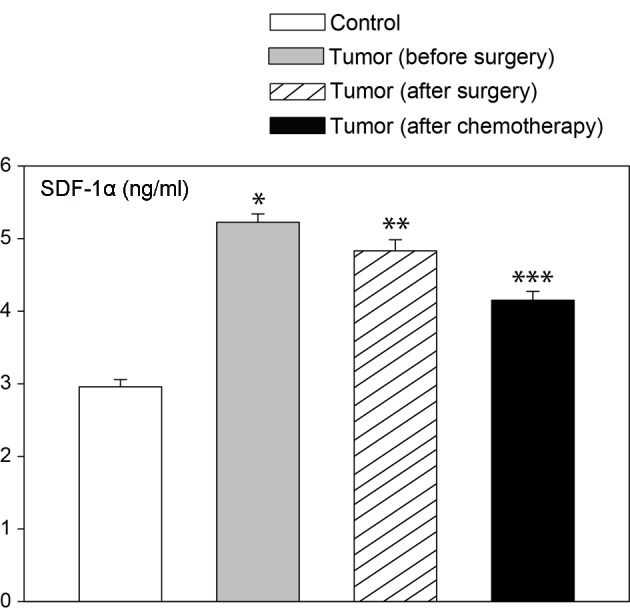
Plasma SDF-1α concentrations (ng/ml) in females with ovarian cancer prior to and after surgery (day 6), and after completion of the first chemotherapy course. The data for 43 cases are shown. The control group includes 30 females. Bars represent the mean ± SE. Statistically significant difference in relation to the control group (Wilcoxon tests): *P<0.05, **P<0.01 and ***P<0.001. SDF-1, stromal cell-derived factor-1.