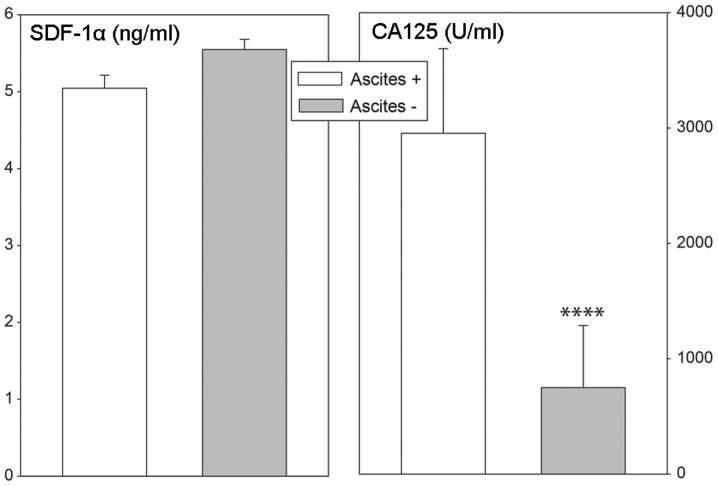
Figure 8.
Plasma SDF-1α (ng/ml) and CA 125 (U/ml) concentrations in ovarian cancer patients in relation to ascites. Open bars represent ascites (n=27), black bars represent without ascites (n=34). Bars represent the mean + SE. Statistically significant difference in relation to ascites group (Mann-Whitney test): ****P<0.001. SDF-1, stromal cell-derived factor-1; CA 125, cancer antigen 125.

