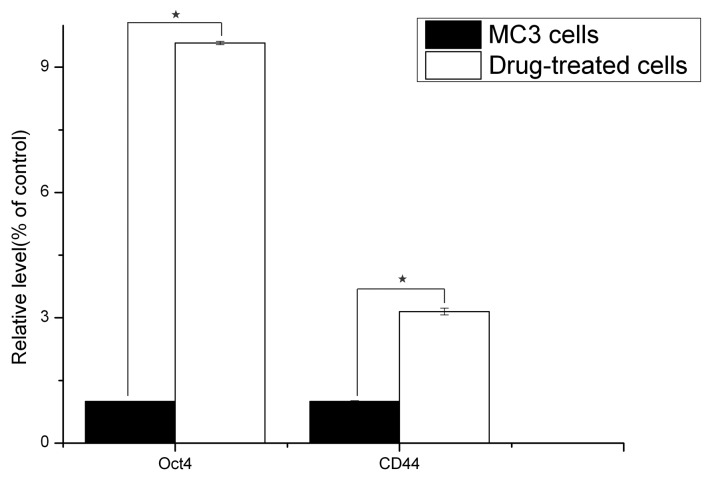
Figure 3.
Gene expression examined by quantitative polymerase chain reaction. The expression of CD44 and Oct4 was statistically different between the 5-Fu (drug)-treated and parent MC3 cells (P<0.05). 5-Fu, 5-fluorouracil; Oct4, octamer-binding transcription factor 4; CD44, cluster of differentiation 44. *P<0.05 parent MC3 cells vs. 5-Fu treated cells

