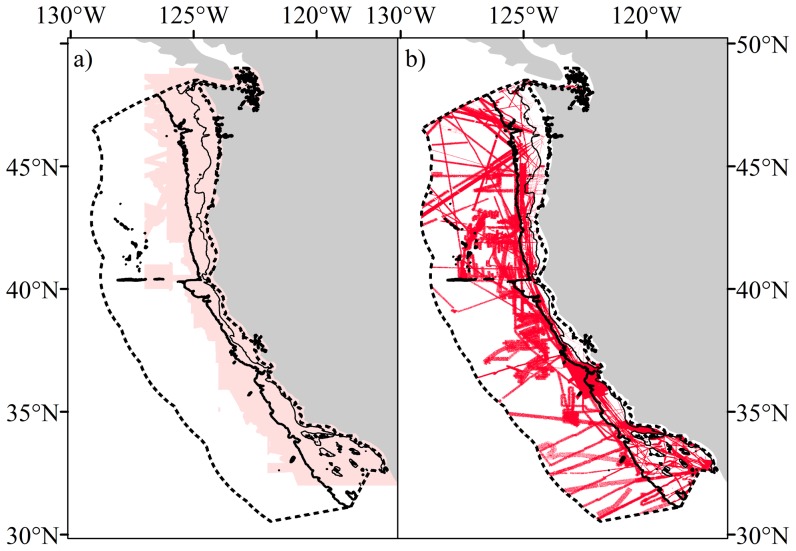
Figure 2. Custom bathymetry.
a) Extent of the Coastal Relief Model data from NOAA (faint red) and the target model domain (dashed line). Faint black line indicates the 200 m contour, bold black line the 2000 m contour. b) Extent of soundings used to construct the custom 500 m×500 m bathymetry used in this study (red). Faint black line indicates the 200 m contour, bold black line the 2000 m contour and the dashed line indicates the analysis extent.

