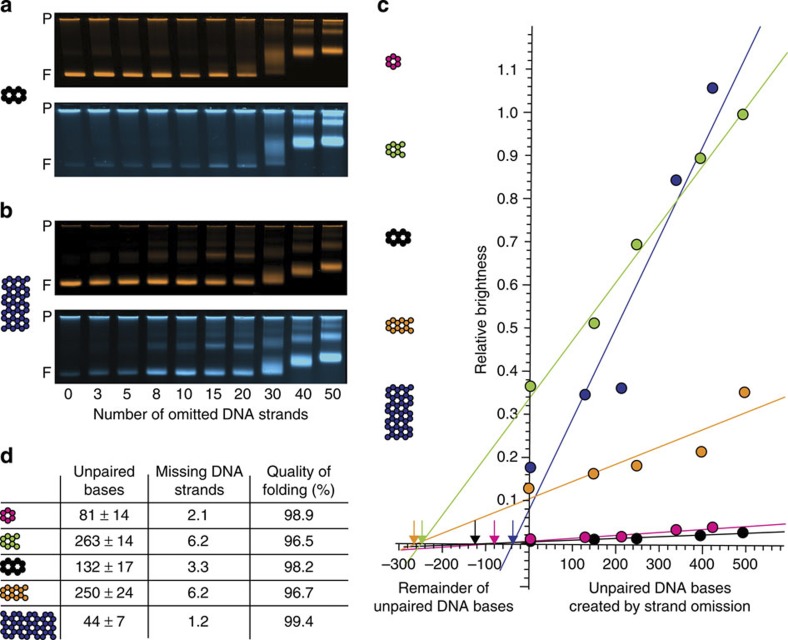
Figure 2. Quantifying the remainder of unpaired DNA bases in self-assembled DNA objects.
(a,b) Exemplary false-coloured laser-scanned photographs of agarose gels on which pseudo-defective variants of a 10-helix DNA origami object (a) and a 42-helix DNA origami object (b) were electrophoresed. Top and bottom images show the fluorescence intensity in the object and defect label channels, respectively. P indicates the gel pocket and F, the target object band. (c) Relative defect label brightness (ratio of band peak intensity as recorded in the defect channel over band peak intensity in object channel) as a function of the content of unpaired DNA bases as created by omitting strands from self-assembly reactions. Coloured circles: data obtained for five different structures (6-, 8-, 10-, 12- and 42-helix bundle DNA origami objects, see coloured cross-sections). Solid lines give linear fits to the data, including an extrapolation to the negative x axis to determine the zero point. (d) Table details properties of self-assembled objects from reactions including all strands, as estimated from data in c. Errors are errors of the linear fit and should only be considered as the minimum extrapolation error with respect to the true unpaired DNA remainder. ‘Missing DNA strands’ were computed as an average strand equivalent by making use of the average length of staple strands in each design. The ‘quality of folding’ was defined as the ratio of formed base pairs over designed base pairs in an object under study.

