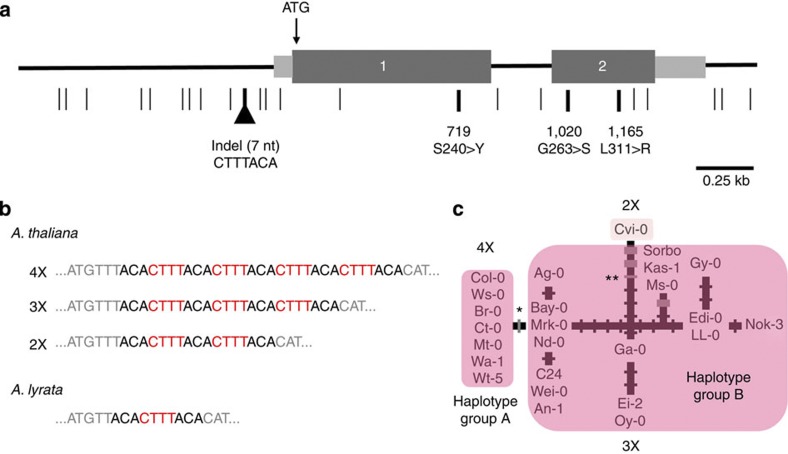
Figure 1. Molecular variation at the CO gene.
(a) Schematic diagram of the CO gene showing relative locations of single nucleotide polymorphisms (SNPs) and indels. Numbered dark grey boxes indicate the exons, while light grey boxes indicate UTRs. The horizontal line indicates extent of sequenced region for CO. The translation start site is indicated by ATG. The light vertical lines are silent site SNPs and the thick vertical lines are nonsynonymous SNPs, which are shown with the amino-acid polymorphisms. The inverted triangle is the relative position of the 7-bp repeat motif at the CO promoter. (b) The sequence of the cis-regulatory CDF1-binding motif at the CO promoter (red cases), showing the variation between accessions that have various repeat numbers of the motif in A. thaliana. The sequence of the motif in an individual in A. lyrata is also shown. (c) Haplotype network of the CO gene. A. thaliana accessions that are found with 4X haplotype group A and 3X haplotype group B alleles are indicated. The thin tick marks are mutations, with the thick tick marks being nonsynonymous changes. The mutation that leads to an increase in the copy number of the 7-bp cis-regulatory repeat from 3X to 4X is indicated by an asterisk, while the decrease in copy number from 3X to 2X by two asterisks.

