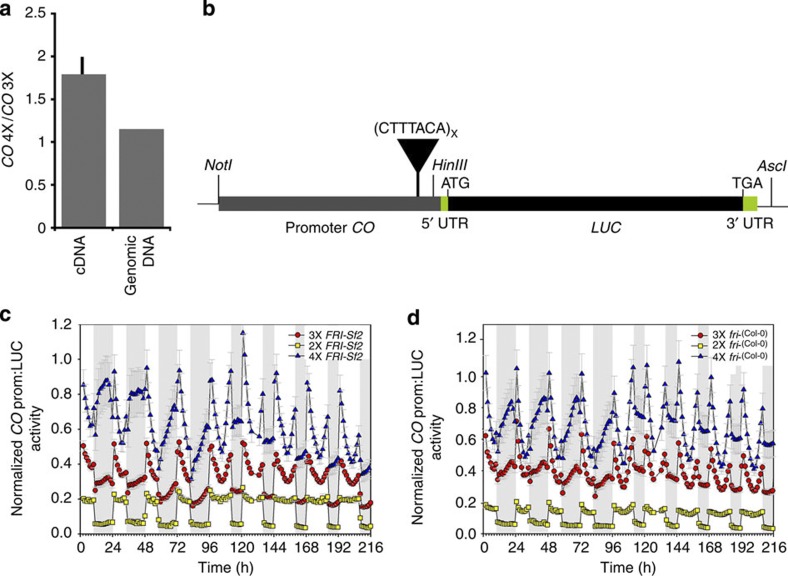
Figure 3. CO promoter type drives differences in gene activity.
(a) Expression ratio in a semi-hybrid (Col-0) heterozygote genetic background measured with pyrosequecing. Genomic DNA was used to quantify PCR biases (n=7 plants). (b) Luciferase gene expression in transgenic reporter lines (see Fig. 2a legend). Luciferase expression was continuously monitored in seedlings in the first 96 h under short days, followed by 120 h in long days. Experimental periods of dark are shown by the light grey boxes. Expression levels of LUC for 2X (n=36 plants), 3X (n=60 plants) and 4X (n=60 plants) CO promoter reporter constructs are shown for (c) FRI+ and (d) fri− backgrounds. Error bars indicate s.e.m.

