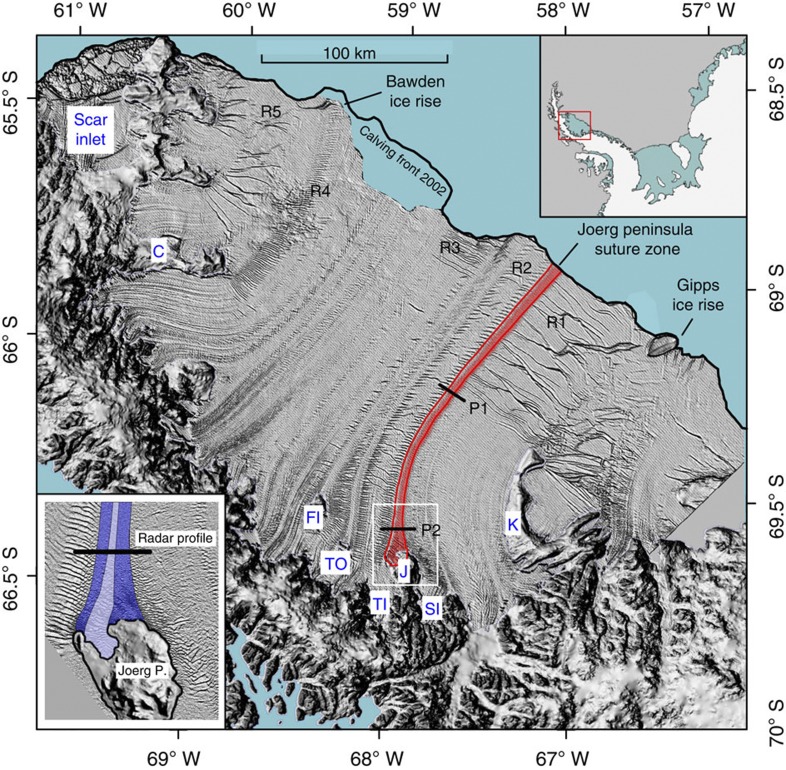
Figure 1. Larsen C model domain.
Aster-Global Digital Elevation Map (GDEM)-( http://nsidc.org/data/docs/agdc/nsidc0516-cook/) derived Digital Elevation Model (DEM) is superposed on a 2008 Moderate Resolution Imaging Spectroradiometer (MODIS) image ( https://earthdata.nasa.gov/data/near-real-time-data/rapid-response). Top inset shows the location of Larsen C ice shelf on the Antarctic Peninsula. The red stripe in the main figure traces the Joerg Peninsula (J)-derived suture zone. P1 and P2 mark the locations of the two ground-penetrating radar profiles shown in Fig. 4. The Joerg Peninsula, Tonkin Island (TO), Francis Island (FI) and Churchill Peninsula (C)-derived suture zones separate prominent areas of rifting (‘R1’ through ‘R5’; part of the Churchill Peninsula (C)-derived suture zone southwest of label ‘R4’ is obscured by clouds). The white box in the main figure outlines the location of the bottom inset. In this inset, the dark blue stripe overlain on a high-resolution Landsat image marks the area of marine-ice accretion. The newly formed suture zone becomes laterally compacted by the neighbouring converging Trail-Inlet (TI) and Solberg-Inlet (SI) flow units. The lighter purple stripe enclosed by the dark blue stripes traces the meteoric ice contribution from a small glacier on the Joerg Peninsula, as revealed by our ground-penetrating radar data (Fig. 4).

