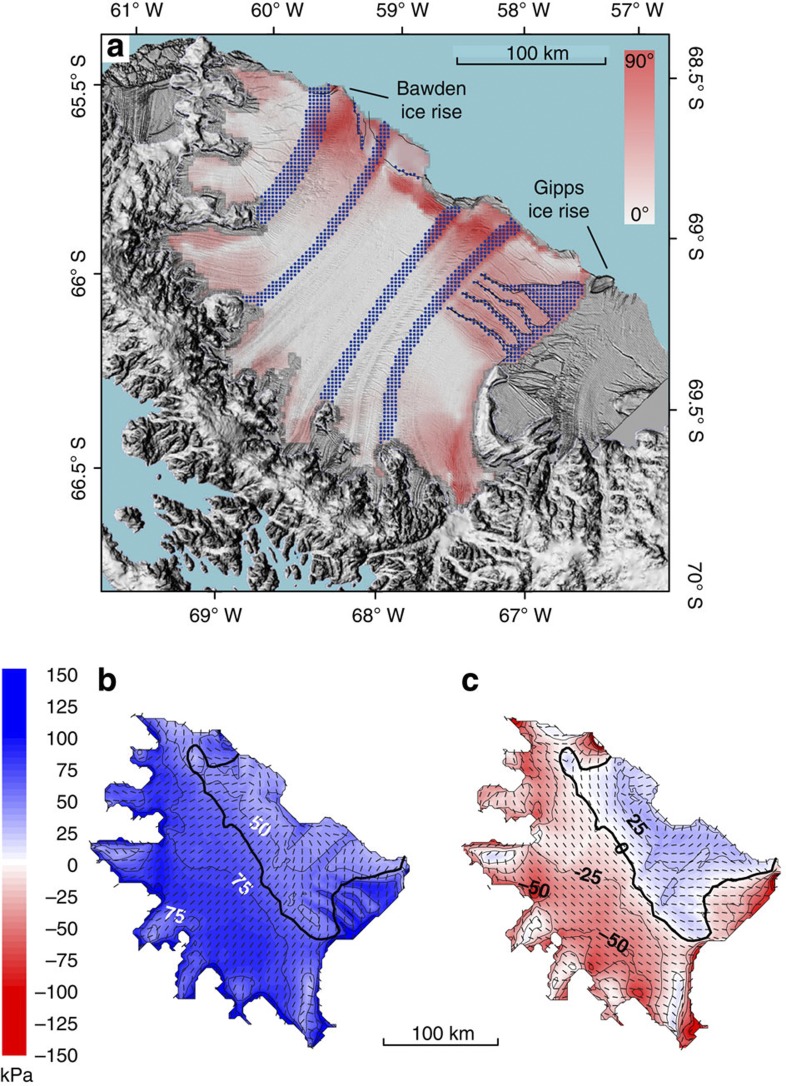
Figure 5. Principal stress fields and stress-flow angles with simulated marine-ice inclusions.
Aster-GDEM-derived DEM ( http://nsidc.org/data/docs/agdc/nsidc0516-cook/) is superposed on a 2008 MODIS image ( https://earthdata.nasa.gov/data/near-real-time-data/rapid-response) of Larsen C ice shelf. (a) Stress-flow angle distribution. Part of the Churchill Peninsula-derived suture zone is obscured by clouds. Blue hatched zones indicate the suture zones and major rifts implemented for the purpose of perturbation experiments with spatially variable ice rigidity. (b) Magnitude (colours) and direction (dashes) of first principal stresses. (c) Magnitude (colours) and direction (dashes) of second principal stresses. In b and c, thick solid lines mark the compressive arch.

