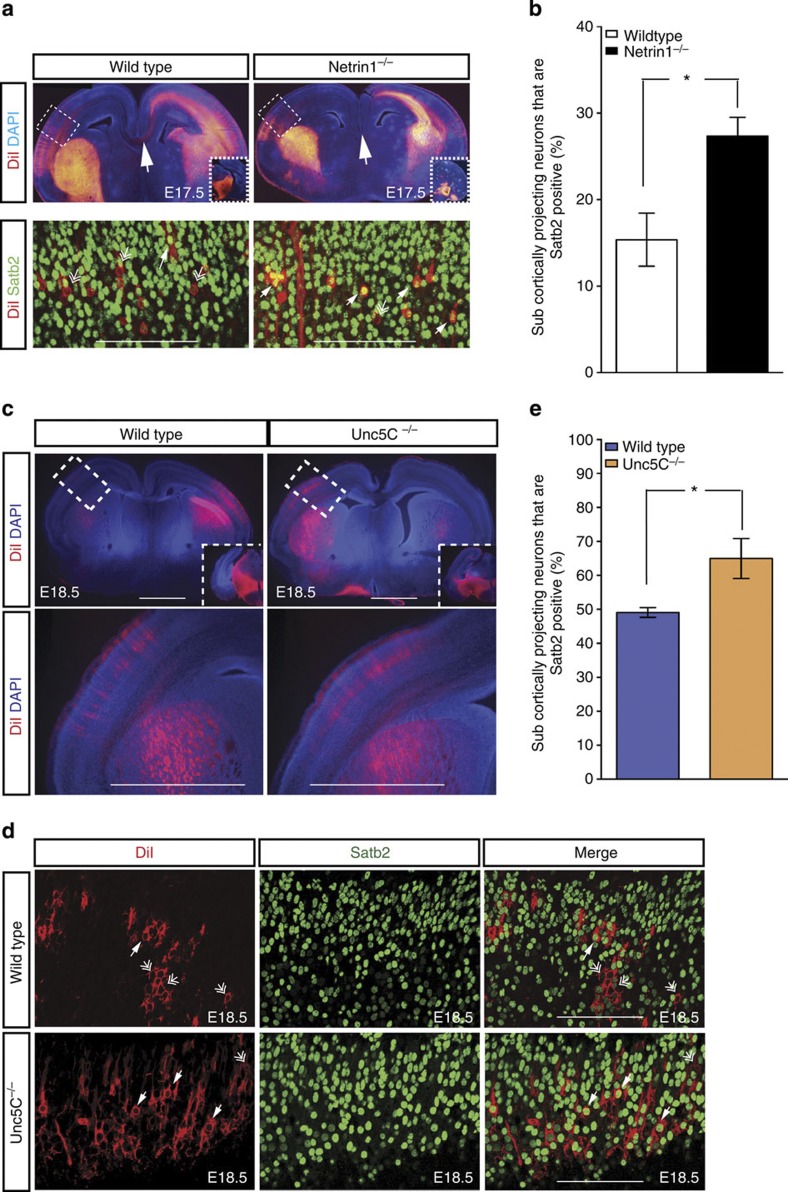
Figure 5. Axons of Satb2 neurons are similarly misrouted to subcortical targets in Netrin1 and Unc5C−/− mutants.
(a) Retrograde labelling of subcerebrally projecting neurons by placing crystals of DiI in the cerebral peduncle of wild-type and Netrin1−/− brains. The smaller inset image shows the respective position of the crystal placement. Retrogradely labelled DiI-positive cells were colocalized with Satb2 in wild-type and Netrin1-mutant brains. Arrows point towards double-positive cells while double arrows highlight single DiI-positive cells. (b) Quantification of the percentage of DiI-positive cells that are Satb2 positive; 15.36% in wild type versus 27.33% in E17.5 Netrin1 mutant, *P-value=0.011 (Student’s t-test), n=3. Error bars represent s.e.m. (c) Crystals of the lipophilic tracer DiI were placed in the cerebral peduncle of wild-type and Unc5C−/− brains to retrogradely label cortical neurons projecting subcerebrally. The smaller inset images show the location of the crystals placed in the cerebral peduncle. Higher magnification image of the boxed region show layer V neurons back-labelled in the cortex. (d) Colocalization of DiI-positive and Satb2-positive cells in the neocortex. Arrows indicate double-positive cells, while double arrows indicate single DiI-positive cells. Scale bar, 100 μm. (e) Quantification of the proportion of subcortically projecting neurons that are Satb2 positive; 49.10% in wild type versus 64.98% in E18.5 Unc5C−/−; *P-value=0.0286 (Student’s t-test), n=3. Error bars represent s.e.m.

