
Fig. 2.
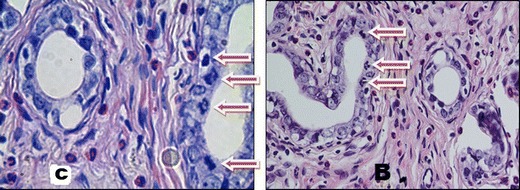
Section of the uterine epithelium. C control group (×1,000), B study group B (×400), with mitotic figures (arrows). H&E staining. A number mitotic figures were seen in groups C and B (median = 1.5 %); in group A, these were very rarely observed (median = 0)