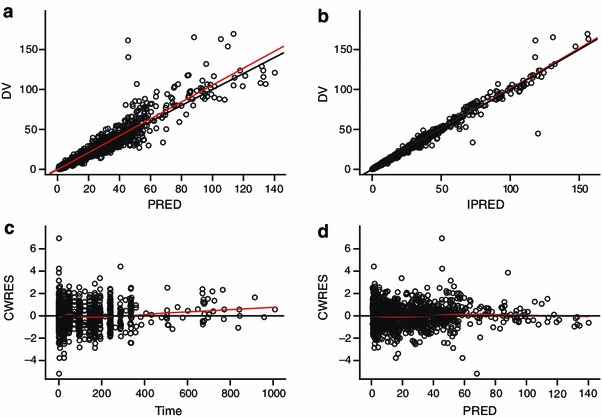
Fig. 4.

Goodness-of-fit plots of the final model. Black solid line is the unity line in a and b. Red solid line represents the linear regression line in a and b and the Loess smoother in c and d; dependent variable (DV) is corrected factor IX (FIX) activity and unit is IU/dL; PRED is the population FIX activity prediction and unit is IU/dL; IPRED is the individual FIX activity prediction and unit is IU/dL; CWRES is conditional weighted residual; Time is the time after dose and unit is hour
