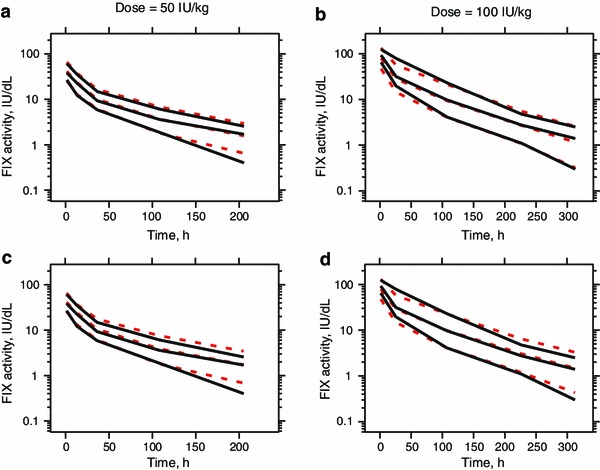
Fig. 5.

Visual predictive check for a and b the final model derived from the modelling dataset, and c and d the model derived from the full dataset. Black solid lines and red dashed lines are 10th, 50th and 90th percentiles of the observation (black) and simulation (red), respectively; a and c represent dose groups of 50 IU/kg; b and d represent dose groups of 100 IU/kg. FIX factor IX
