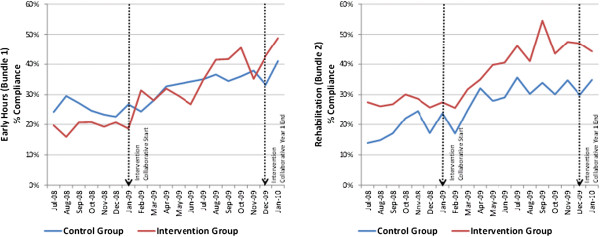
Figure 3.

Bundle compliance over time in the control and intervention group. In bundle 1, for the control group, compliance went from 24.3% to 37.5% (13.2% change) and in the intervention group, from 19.6% to 42.3% (22.7% change). On crude comparison, this is a difference of 9.5%, but with all the various adjustments for clustering, this results in a relative benefit of 10.9% in the intervention relative to the control group.
