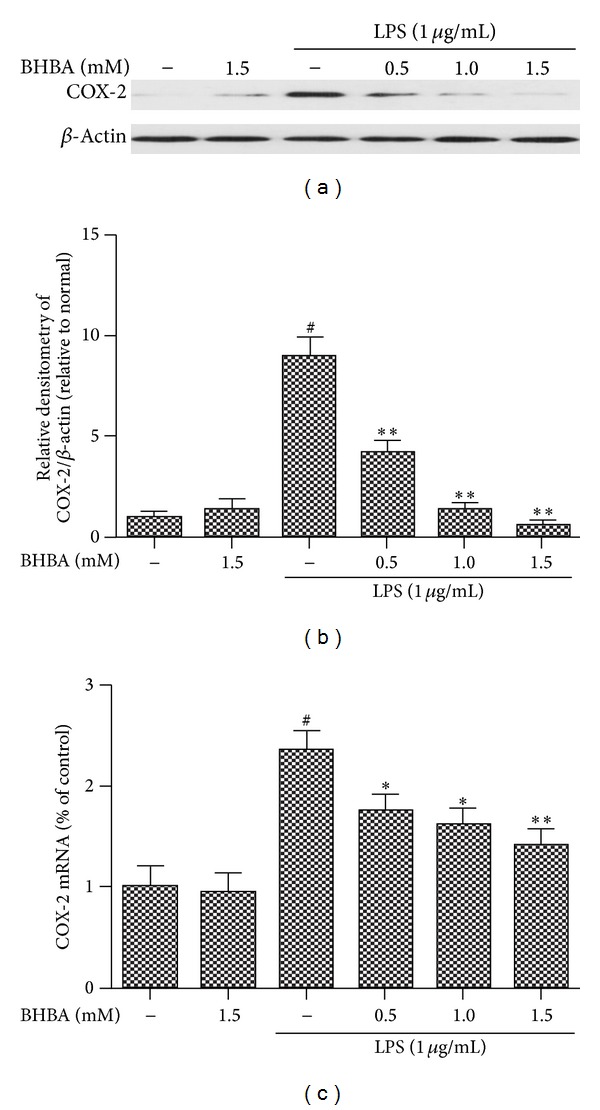
Figure 3.

Effects of BHBA on LPS-induced protein and mRNA expression of COX-2 in BV-2 cells. Cells were pretreated with BHBA (0.5, 1.0, and 1.5 mM) 1 h prior to incubation of LPS (1 μg/mL) for 4 h. The levels of protein and the corresponding mRNA were determined by western blotting and quantitative real-time PCR as described in Section 2. (a) and (b) show protein expression of COX-2 and (c) shows the corresponding mRNA data. The relative mRNA level was normalized to β-actin mRNA; the relative protein levels were quantified by scanning densitometry and normalized to β-actin. Results are expressed as mean ± SD for each group from three independent experiments. #Significantly different when compared with control alone, P < 0.05. *P < 0.05 and **P < 0.01 versus the BHBA-untreated LPS-stimulated group.
