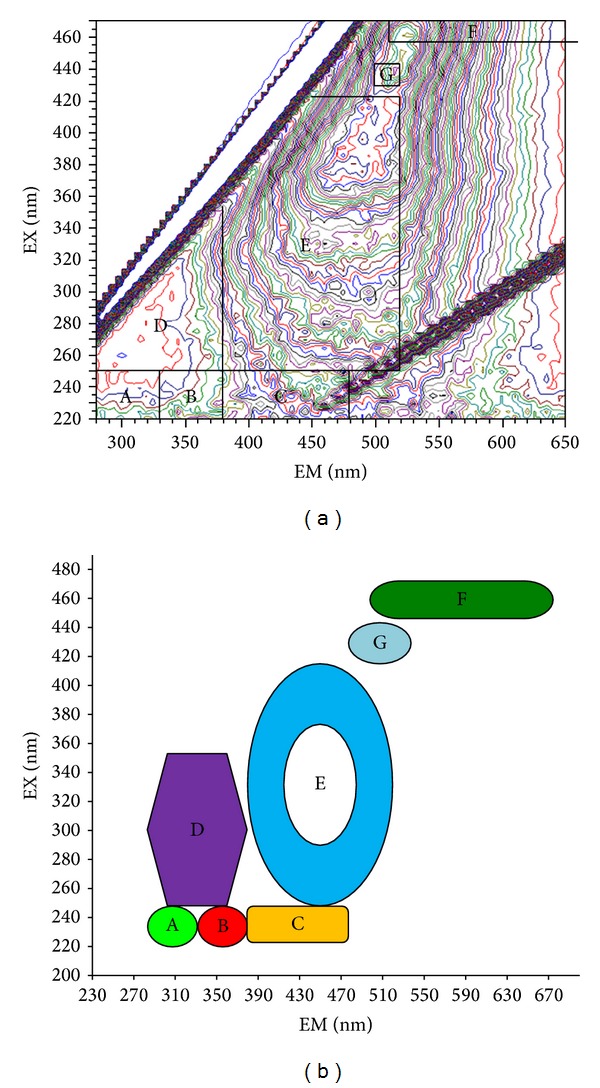
Figure 2.

Schematic diagrams with partition method of fluorescent substances of GRSP by using 3D fluorescence spectrum. (a) Fingerprint of the partition of fluorescent substances; (b) pattern of the partition of fluorescent substances. Note: A: tyrosine-like protein, 220–250 nm in excitation and 280–330 nm in emission; B: tryptophan-like protein, 220–250 nm in excitation and 330–380 nm in emission; C: fulvic acid-like, 220–250 nm in excitation and 380–480 nm in emission; D: soluble microbial byproduct-like, 250–360 nm in excitation and 280–380 nm in emission; E: humic acid-like, 250–420 nm in excitation and 380–520 nm in emission; F: nitrobenzoxadiazole-like, 460–470 nm in excitation and 510–650 nm in emission; G: calcofluor white-like, 440 nm in excitation and 500–520 nm in emission.
